Visualizing a path
to better cancer
treatment
At a glance
VISION
Sygnomics set out to build a machine learning application to help oncologists predict how a patient’s cancer progresses and tailor therapies to match that profile. But they needed to show potential partners how it would work.
Impact
In roughly two months, Slalom developed a vision for the product and delivered a web-based app prototype and data visualization dashboard for oncologists to customize treatment for better patient outcomes.
Key Services


Industry
Health tech
Technologies/Platforms
Ready to turn complex data into better decisions?
Let’s innovate together
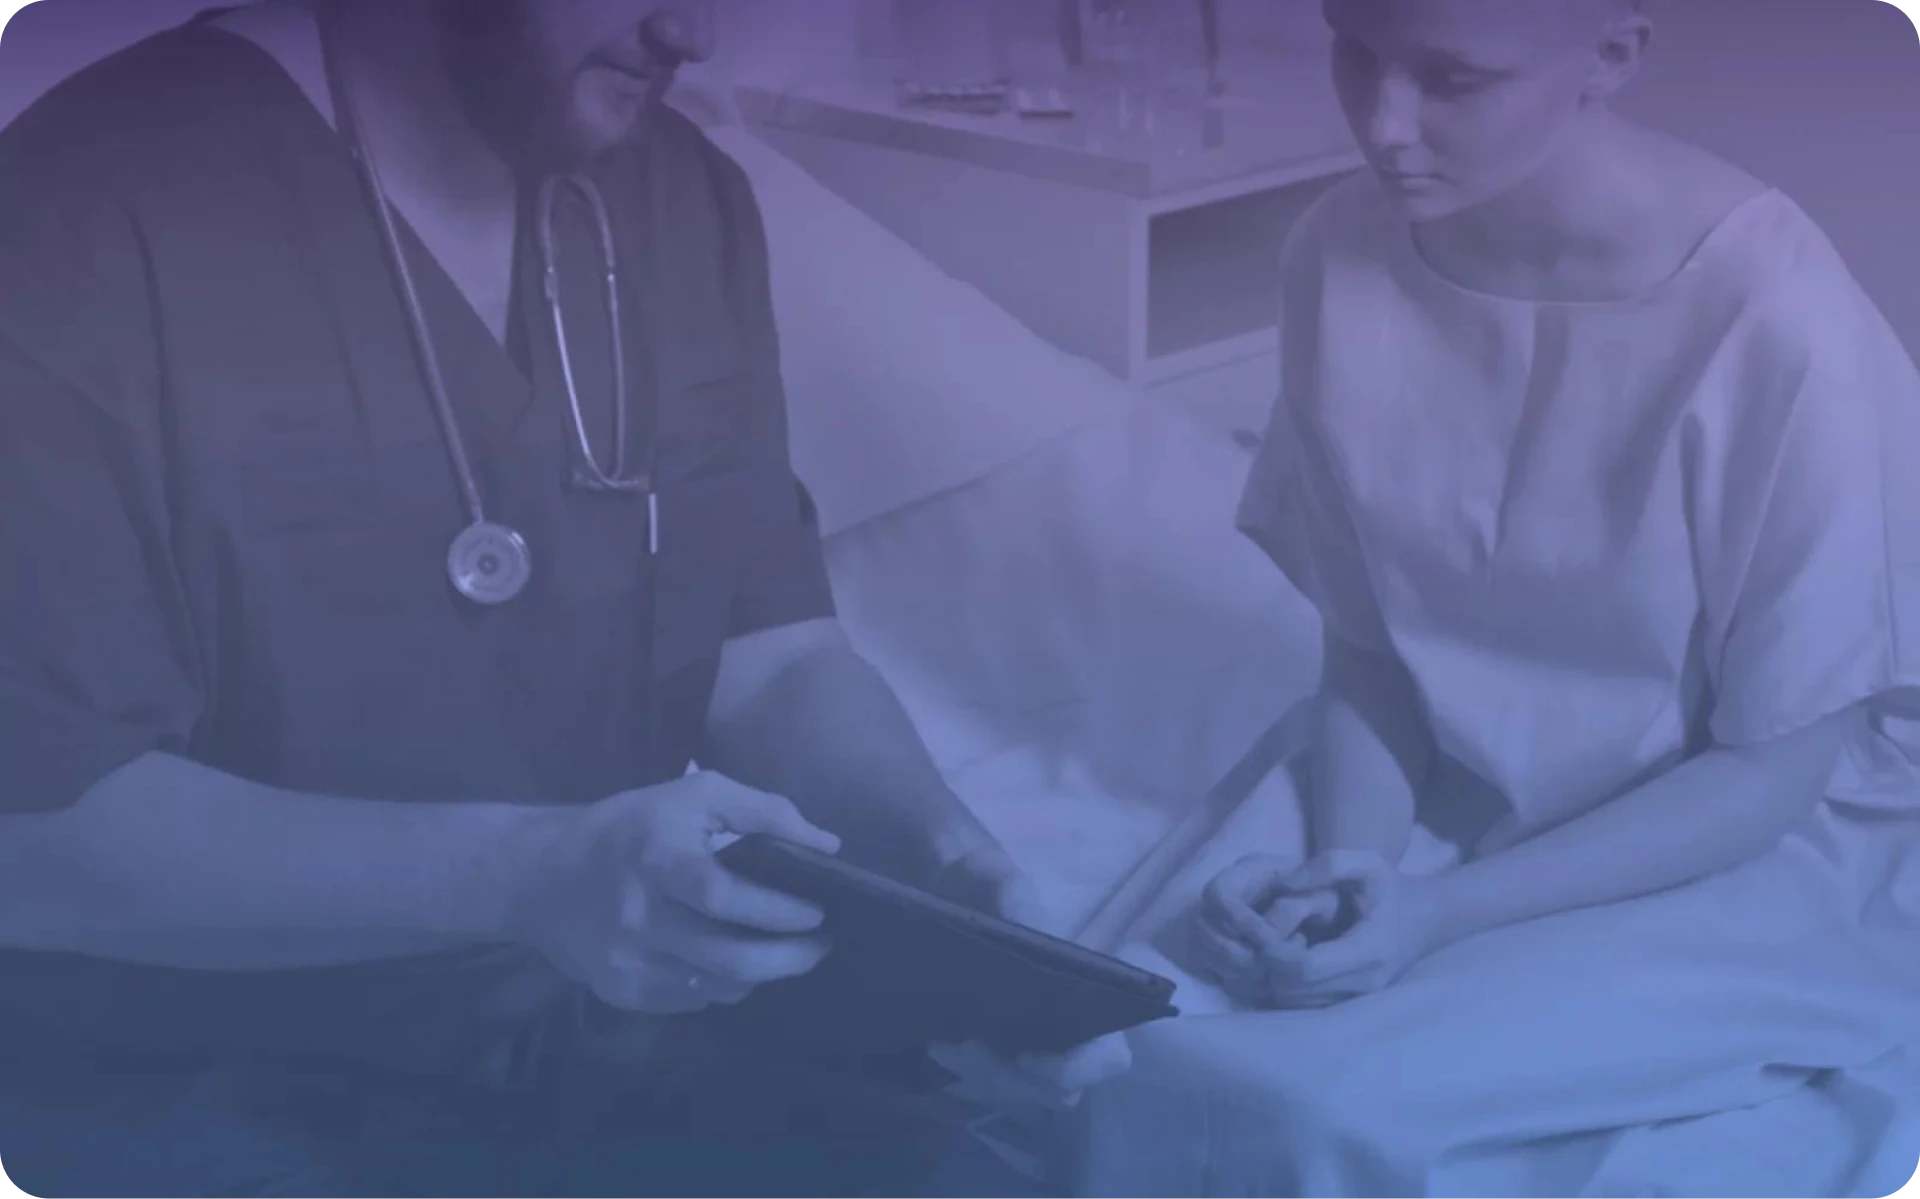
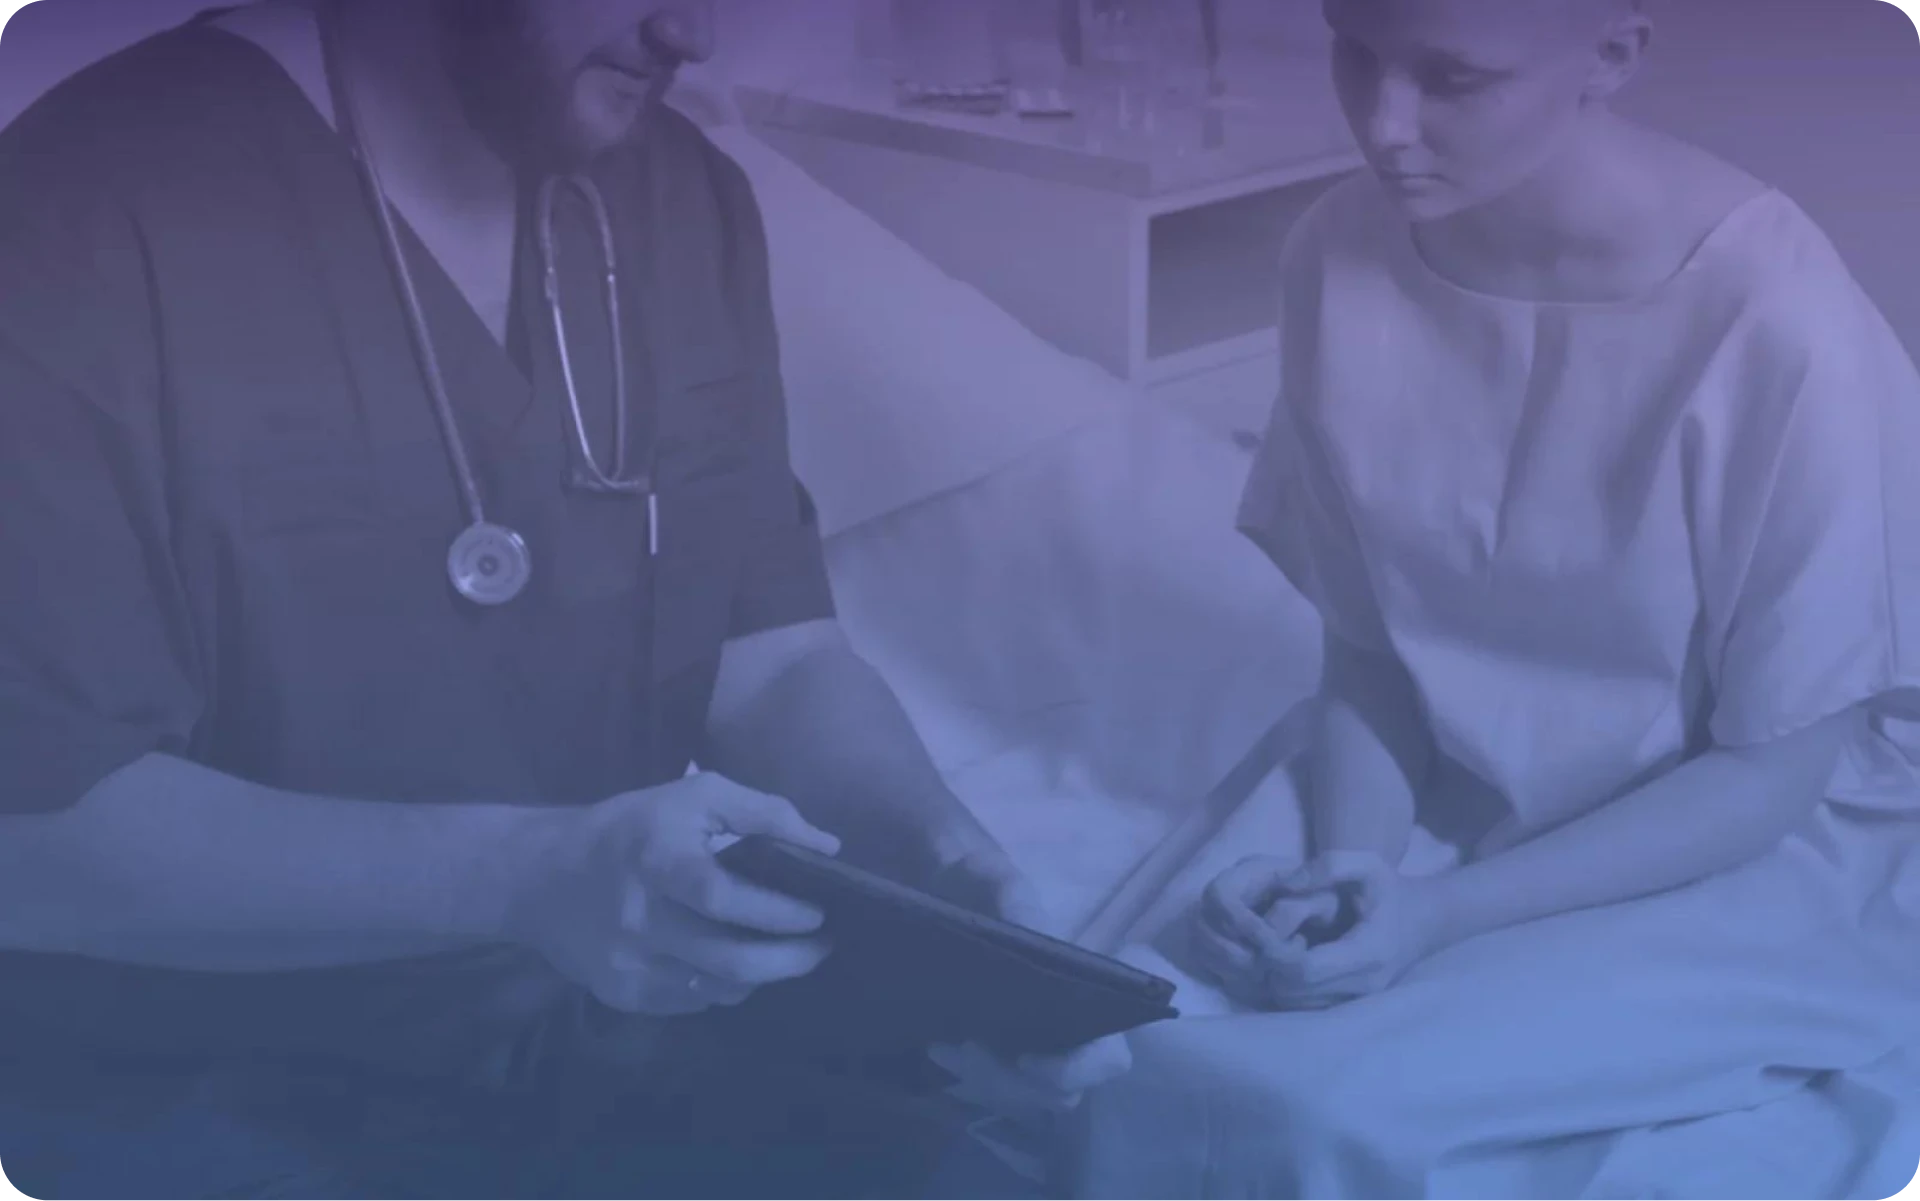
Helping doctors see the fight against cancer differently
The fight against cancer is complex and rarely straightforward. That challenge came into sharper focus when oncologists at explained that every cancer—and every cancer patient—is unique.
It’s this complexity, in part, that causes most new cancer drugs to fail in clinical trials. Matching the right drug to each tumor is beyond
difficult. And the risk and cost of failure loom unimaginably high.Sygnomics
But the oncologists and technologists at Sygnomics set out to build a solution.
They created Systems Genetics Network Analysis (SYGNAL), an intelligence platform designed to help doctors and researchers visualize how a patient’s cancer may progress and recommend treatments with predicted therapeutic efficacy for that profile. SYGNAL achieves this by comparing anonymized genetic and demographic information. Using a machine learning model, the platform can improve its recommendations over time as new expert-reviewed data is entered.
In the end, the SYGNAL prototype we built allows users to create an account, log in, and view various dashboards presenting patient blueprints, relevant therapies, and risk analysis—all in a polished, responsive, easy-to-use web application that looks as good as it functions.
It’s a big idea—one that’s easier to explain with visual aid. That’s why Sygnomics needed a functional prototype of a web-based app with data visualization dashboard to demonstrate SYGNAL to other oncologists and potential partners.
We also left them with a roadmap for how their machine learning model could further mature. This future-state architecture will help them more easily add value and flexibility to later iterations of the product, developing more personalized therapy recommendations for each patient.
Building “easy-to-use” is anything but simple
Destined for the desks of busy doctors and scientists, the user experience had to be intuitive. Design and visualizations needed to be scientifically useful as well as accurate and simple to understand. We conducted regular user testing sessions with oncologists to not only better understand their needs, but get a true, real-world measure of the efficacy of this proof of concept.
In addition to the app, we also had to build trust. Our team worked to secure, anonymize, and encrypt the data to meet FDA and HIPAA compliance. And on the front end, it had to be contextualized so oncologists could be confident that the data came from an authoritative source.
What’s more, we didn’t have access to the complete dataset right away. So, initially the team worked with mock data that didn’t tell engineers everything they needed— which meant more research, data modeling, personally identifiable information (PII) anonymization, and converting data to get it in the right format.
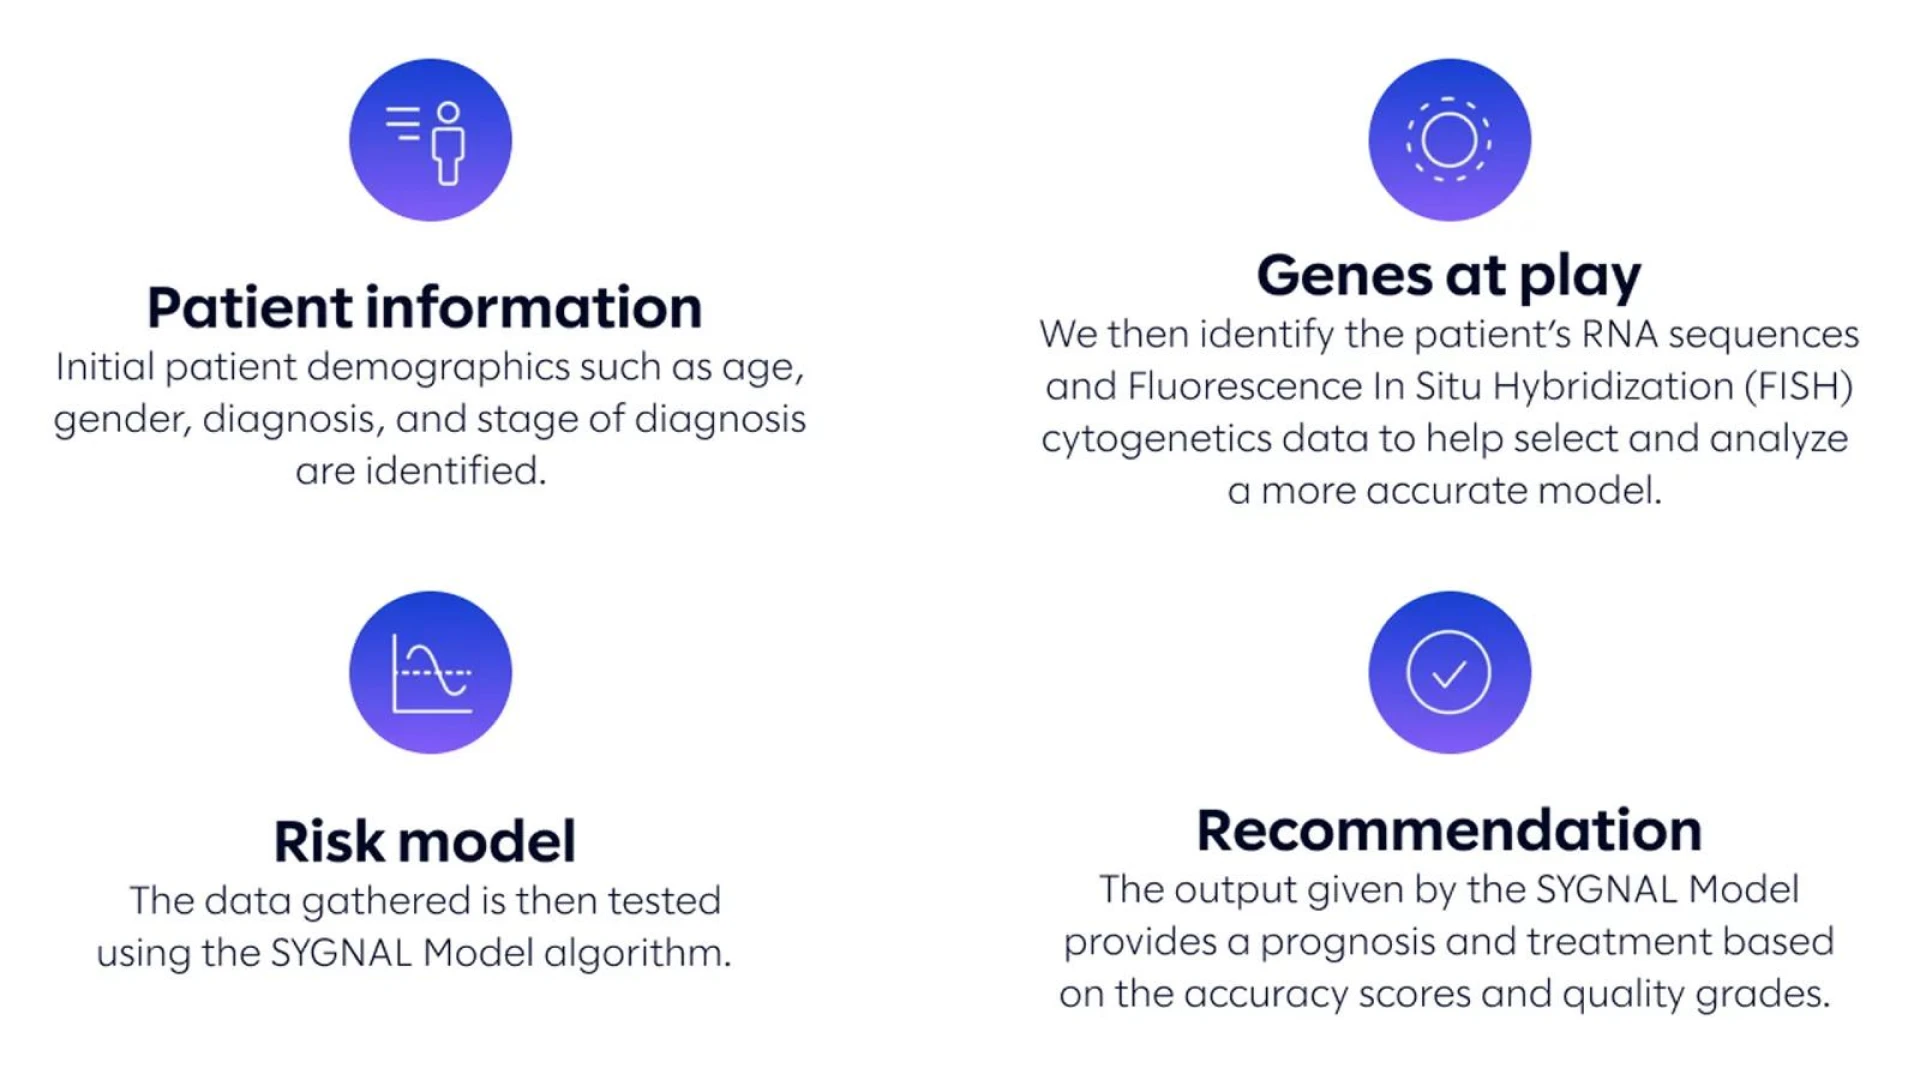
Patient information
Initial demographics such as age, gender, diagnosis, and stage are identified.
Genes at play
RNA sequences and FISH cytogenetics data help select and analyze a more accurate model.
Risk model
The gathered data is tested using the SYGNAL Model algorithm.
Recommendation
The model output provides prognosis and treatment guidance based on scores and grades.
In the fight against cancer, vision is key
This project highlights why effective data visualization is so important in machine learning applications: it translates complex information into digestible, shareable, and more powerful ideas. With this platform, Sygnomics hopes to motivate oncologists to share more insights and help each other make greater progress. And that could lead to better health outcomes for patients.
This work brought Sygnomics closer to realizing its vision for the SYGNAL platform, setting in motion a continuous learning loop powered by machine learning to help oncologists help more people. It’s an exciting and hopeful idea that shows how important vision and visualization are in the fight against cancer.
You should be incredibly proud of all the work that you did. Hopefully someday you can see an oncologist using a piece of software and say, ‘I helped that patient get better.’ And that will be powerful.
Ashutosh TiwaryFounder, Sygnomics
Ready to improve patient care and outcomes?
You may also like

Let’s solvetogether.
Get in touch

Newsroom
Visit the newsroomLet’s solvetogether.
Get in touch