
A finance director asks one question before any CRM budget is approved: what will it return, and when? Most sales leaders answer with a vendor percentage. That number rarely survives the first review, because it says nothing about this company, its reps or its pipeline.
CRM ROI is the net gain a CRM produces, divided by everything it costs, over a set period. A credible figure starts from your own baseline metrics and prices every cost line. It also runs for three years. This guide covers the formula, the inputs and the proof after go-live.
Key Takeaways
- CRM ROI equals net benefit divided by total cost, measured over a three-year window with a recorded baseline.
- Implementation, data migration, training and administration often cost more than licences in year one.
- A negative first-year return is normal, so the payback month matters more than the year-one percentage.
What Is CRM ROI and Why Does It Matter?
CRM ROI is the percentage return on the money a business spends to buy, implement and run a CRM. It compares measurable gains, such as higher win rate or time saved per rep, against the total cost of ownership.
The figure does two jobs. It decides whether the project gets funded, and it sets the targets the project is judged against after go-live. A CRM investment without a stated return has no finish line, so nobody can say whether it worked.
Return is narrower than the general idea of CRM value. Value includes softer gains, such as a cleaner customer history or easier handovers. ROI counts only gains a finance team accepts as cash: revenue margin or cost savings. Keep the two lists apart and the business case stays credible.
That distinction is a reason to build the model before the project starts. Teams that build it during CRM consulting and implementation can design workflows around the benefit lines. Teams that build it afterwards often find the system never captured the data needed to prove anything.
A clear return on CRM investment protects the project later, too. A new sales director may ask why the company pays for Salesforce or HubSpot. A documented return answers that question with numbers instead of opinions.
How Do You Calculate CRM ROI Step by Step?
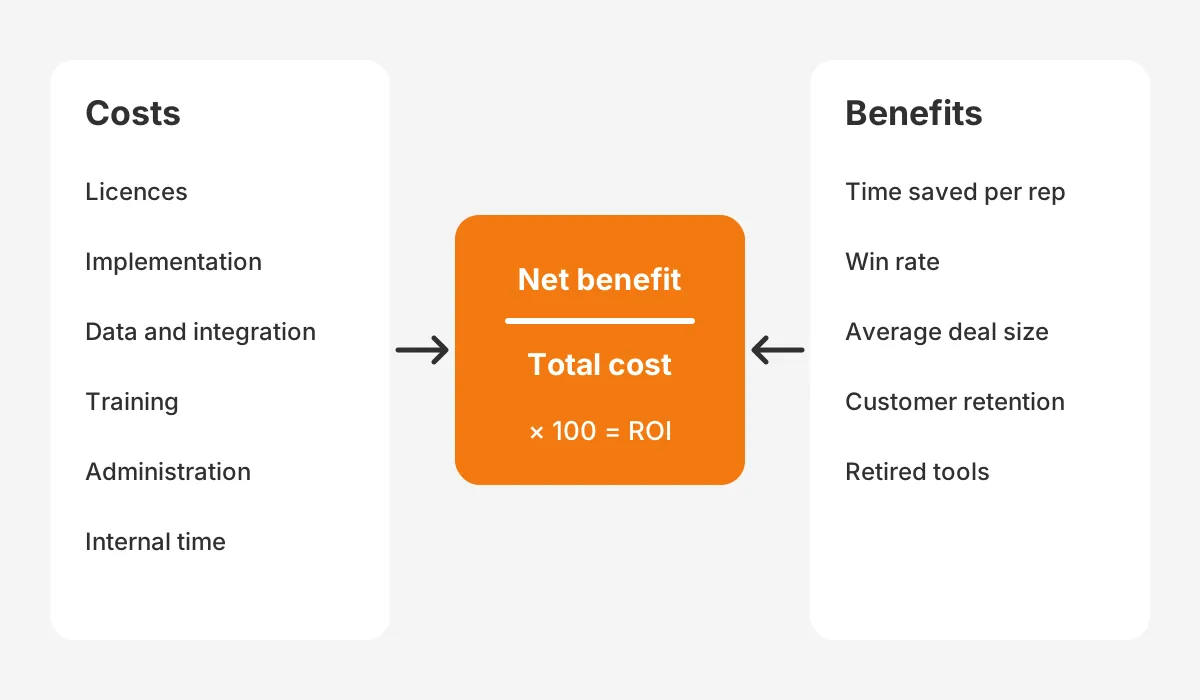
The CRM ROI formula is the standard ROI formula applied to a CRM. It divides net benefit by total cost and multiplies by 100. Net benefit is total benefits minus total costs over the same period.
Written out, it reads: CRM ROI = (total benefits minus total costs) / total costs × 100. The hard part is the inputs. Here is how to calculate CRM ROI in a way a finance team will sign off.
- Pick the period. Use three years, because licences and implementation costs are front-loaded.
- Record baseline metrics for the last 12 months: win rate, average deal size, sales cycle length and customer retention.
- Price every cost line: licences, implementation, data migration, integration, training and administration.
- Choose three to five benefit lines that the CRM will move directly, and estimate each change conservatively.
- Convert revenue gains to gross margin, so the benefit is profit and not turnover.
- Apply a ramp: count about half the benefit in year one while user adoption builds.
- Run the formula for each year and for the full three years, then find the payback month.
Measuring CRM ROI this way gives two numbers instead of one. The three-year percentage shows the size of the return. The payback month shows the cash risk, which is often what the finance director cares about most.
A CRM ROI calculator can speed up the arithmetic, but it cannot supply the inputs. Most online calculators ask for revenue uplift as a single percentage. That hides the assumptions a reviewer will want to test. Build the model in a spreadsheet with one row per line instead.
What Costs Belong in a CRM ROI Model?
A return model should include every cost of owning the system for three years. That means more than the CRM license cost. Total cost of ownership is the honest denominator, and it is usually larger than the subscription quote.
The table below lists the cost lines to price. The crm implementation cost lines are mostly one-off, while licences and administration repeat every year.
| Cost line | What it covers | One-off or recurring |
|---|---|---|
| Licences | Per-user subscription for every seat, plus paid add-ons | Recurring |
| Implementation | Discovery, configuration, automation and testing by a partner or in-house team | One-off |
| Data migration | Cleaning, mapping and loading records from the old system | One-off |
| Integration | Connections to ERP, email, marketing and finance tools | One-off plus upkeep |
| Training and change management | Role-based sessions, guides and adoption support | Mostly one-off |
| Administration | A CRM administrator, internal or outsourced | Recurring |
| Internal time | Hours your staff spend in workshops and testing | One-off |
Two cost lines are missed most often. The first is internal time, because staff hours never arrive as an invoice. The second is administration, which keeps the system useful after the partner leaves. The Unboxx breakdown of CRM implementation cost drivers shows how each line is priced.
Published studies show the same split. In the Forrester Total Economic Impact study of Salesforce for Manufacturing (2024), subscriptions were $3.6 million over three years. Implementation and integration added about $2.0 million, and change management, training and admin added $2.1 million. Subscriptions were less than half of total cost.
Opportunity cost belongs in the notes, not the formula. Record any selling hours the team loses during rollout. Treat that estimate as a risk to the year-one figure.
Which CRM Benefits Should You Count?
Count only CRM benefits that the system changes directly and that you can measure against a baseline. Three to five benefit lines are enough. More lines usually means weaker evidence behind each one.
These are the benefit lines that hold up best in review:
- Time saved per rep: hours no longer spent on manual data entry, reporting and searching for information.
- Win rate: a higher share of qualified opportunities closed, from better follow-up and pipeline visibility.
- Average deal size: larger orders from consistent cross-sell prompts and quote templates.
- Customer retention: fewer lost accounts, because renewals and service issues are tracked.
- Retired tools: spreadsheets, add-ons or legacy systems the CRM replaces.
Sales productivity tends to be the largest line, because so little of a rep's week goes to selling. Salesforce's State of Sales research (2022) put that share at 28%. Each hour moved from admin back to customers counts at the loaded hourly cost of a rep.
Revenue lines need one adjustment. Convert extra revenue to gross margin before it enters the formula. A $200,000 revenue gain at a 40% gross margin is an $80,000 benefit. Skipping this step is the most common way a business case overstates crm roi.
Customer lifetime value and lead conversion rate are useful supporting measures. Use them to explain why win rate or retention moved, rather than counting them as separate benefits. Counting the same gain twice makes the whole model easier to reject.
Give every benefit line a named owner. The sales director owns win rate, the sales operations lead owns time saved, and the account management lead owns retention. An owner signs off the estimate before approval and reports the actual figure at each review. Lines without an owner tend to drift.
What Does a Worked CRM ROI Example Look Like?
This crm roi example uses assumed figures for a mid-sized B2B company with 20 sales reps. Every figure below is an illustration, not a benchmark, so replace each one with your own baseline.
Costs. Licences are 20 users at $100 per user per month, or $24,000 a year. Implementation is $60,000, data migration and integration $20,000, and training $10,000. Half of one administrator costs $45,000 a year. Years two and three add $10,000 each for improvements.
Benefits. Each rep saves three hours a week for 46 weeks, valued at $60 an hour, which is $165,600 a year. Win rate rises from 20% to 22% on 400 opportunities of $25,000, adding $80,000 of gross margin. Two retired tools save $12,000 a year.
| Line | Year 1 | Year 2 | Year 3 |
|---|---|---|---|
| Total costs | $159,000 | $79,000 | $79,000 |
| Total benefits | $134,800 | $257,600 | $257,600 |
| Net benefit | -$24,200 | $178,600 | $178,600 |
| Cumulative net | -$24,200 | $154,400 | $333,000 |
Year one counts half the time and margin benefits, because adoption ramps up. That produces a first-year return of minus 15%. Over three years, net benefit is $333,000 on total costs of $317,000, a CRM ROI of 105%.
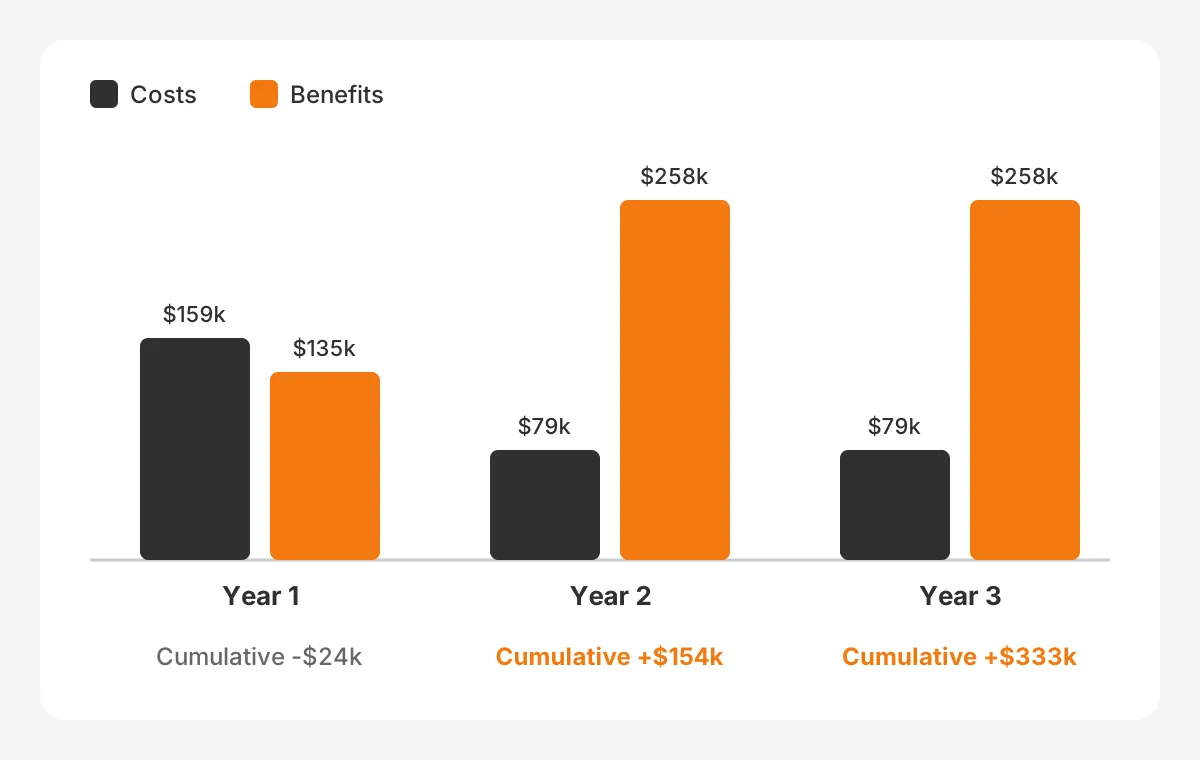
The model also gives the crm payback period. The year-one shortfall of $24,200 is recovered in under two months of year two, so payback lands around month 14. That single number often decides approval faster than the three-year percentage.
Test the model before you present it. Cut the time saved per rep in half and rerun the formula. In this example, three-year benefits fall by about $207,000 and ROI drops to roughly 40%. If the case still holds under that cut, it is a sound business case.
What CRM ROI Benchmarks Do Published Studies Show?
Published CRM ROI benchmark figures run from a 215% return to $8.71 back for every dollar. Most come from vendor-commissioned studies. Use them to sense-check your model, never as its inputs.
Each study also defines its terms differently. Some count revenue, others count profit. Some include internal staff time as a cost, others leave it out. Before comparing your figure with a published one, check what each side counted.
Nucleus Research (2014) found that CRM returned $8.71 for every dollar spent, up from $5.60 in 2011. The figure is widely quoted, but it is now more than a decade old.
The Forrester TEI study of Salesforce for Manufacturing (2024) reported a 354% ROI and payback in under six months. It modelled a composite $2.3 billion manufacturer and found each rep saved 490 hours a year.
Microsoft summarised the Forrester TEI study of Dynamics 365 Sales (2022). It reported a 215% ROI over three years and payback in seven months. That gives one useful dynamics 365 roi reference point.
Read these studies with three cautions. The vendor commissions them and supplies the interviewed customers. The composite company is often far larger than a mid-market firm. And the studies count benefits a finance team may not accept, such as revenue growth before margin.
That leaves the question of what is a good crm roi for a mid-sized B2B company. A three-year return above 100%, with payback inside 18 months, is a reasonable target. Salesforce roi and hubspot roi claims in vendor material are higher, because they describe well-run projects at scale.
How Long Is the Typical CRM Payback Period?
Commissioned studies report a payback period of six to seven months for well-run CRM projects. Mid-market projects with heavy data work often take longer, so a target inside 18 months is a sensible planning figure.
Asking how long does it take to see crm roi means asking when each benefit line starts to move. Savings from retired tools arrive within the first quarter.
Time saved per rep shows up once most licensed users work in the CRM daily. A working rule is a crm adoption rate above 80%. Win rate and retention gains take two or three sales cycles to show.
Three factors stretch payback:
- Low data quality at go-live, which pushes reps back to spreadsheets.
- Customisation beyond what the first release needs, which raises the one-off cost.
- Training squeezed into one session, which slows the adoption rate.
Net present value adds a second view for larger projects. Discount each year's net benefit at your company's discount rate, often 8% to 10%. A positive NPV confirms the CRM investment beats the return the business expects from its capital.
In the worked example, a 10% discount rate gives an NPV of about $259,800 over three years. That is lower than the undiscounted $333,000, because later benefits are worth less today. The project still clears the hurdle with room to spare.
A common worry is whether crm roi can be negative. In year one it usually is. A negative figure after year two is the real warning sign. It points to low adoption, the wrong benefit lines or a cost overrun, and each one needs a different fix.
Which Metrics Prove CRM ROI After Go-Live?
The metrics to measure crm roi after go-live are the same baseline metrics recorded before the project. Compare like with like, over the same months, using the same definitions.
Track these on a CRM dashboard that the sales leader reviews each month:
- User adoption: daily active users as a share of licensed users.
- Time saved per rep: hours on admin tasks, taken from a short monthly survey.
- Win rate and average deal size on qualified opportunities.
- Sales cycle length from qualified opportunity to close.
- Customer retention and renewal rate by account segment.
- Forecast accuracy: forecast versus actual bookings each quarter.
Set three review points. At 90 days, check adoption and data quality, because they lead every other metric. At six months, check time saved and pipeline hygiene. At 12 months, run the full formula again with actual figures instead of estimates.

Revenue attribution is the hardest part of measuring crm roi. Market conditions and pricing changes also move win rate. Compare against the same quarter last year. Note any price change or new product, so the CRM is not credited with every gain.
Good crm reporting makes this review fast. If the numbers take a week to assemble, the dashboards need work before the 12-month review. A reporting success story from an Unboxx client shows what a usable review looks like.
Why Do CRM Projects Fail to Return Value?
When a CRM misses its business case, the cause is usually adoption, not software. People use the system differently from the way the case assumed, so the benefit lines never move.
The common causes of why crm projects fail are consistent across platforms:
- No baseline, so nobody can prove what changed.
- Requirements written around the old process instead of the target one.
- Dirty data loaded at go-live, which erodes trust in the first week.
- Training treated as a single event instead of a programme.
- No owner for administration after the partner leaves.
Each cause maps to a cost line or a benefit line in the model. Weak training lowers time saved per rep. Dirty data delays win rate gains. Missing administration lets the system decay, so year-three benefits never arrive.
Change management is the control that ties these together. Name an executive sponsor, publish the metrics that define success, and review them in the sales meeting. Reps adopt a CRM faster when they see managers use the same dashboards.
Gathering the right requirements up front prevents most of these failures. The Unboxx guide to ranking and scoring CRM requirements shows how to tie each requirement to a measurable outcome.
How Can You Improve CRM ROI on Existing Systems?
To improve CRM ROI on a system you own, raise adoption and remove manual work first. Buy nothing new until that is done. Most of the gain sits in fixing what is already there.
Start with a short audit. Measure adoption by team, list the reports people rebuild in spreadsheets, and find the fields nobody fills in. A structured CRM audit with a scored checklist gives a 90-day fix plan.
Then work through the levers in order of payback:
- Clean and deduplicate data, so reps trust what they see.
- Automate the top three manual tasks, such as activity logging and follow-up reminders.
- Rebuild the core dashboards around the baseline metrics.
- Retire overlapping tools and cancel unused licences.
- Run role-based crm training for each team, with a refresher after 60 days.
Each lever has a cost and a benefit, so it fits the same formula. Retiring unused licences is the fastest win, because the saving is immediate and certain. Automation takes longer but usually adds the most time back to the sales pipeline.
For a crm roi for small business, keep the model simple. Use one benefit line, usually time saved, and one cost line for licences plus setup. A five-person team saving two hours each a week can justify crm cost on time alone.
Frequently Asked Questions
What is the ROI of a CRM?
The answer to what is the roi of a crm depends on adoption, data quality and cost control. Commissioned Forrester studies report 215% to 354% over three years. A mid-sized B2B company should model its own figure from baseline metrics. Treat 100% over three years as a reasonable target.
How do you measure CRM success beyond revenue?
To measure crm success beyond revenue, track user adoption, data quality, time saved per rep and forecast accuracy. These leading indicators move within the first six months. Revenue measures such as win rate and retention follow later, once reps use the system every day.
How do you build a CRM business case?
To build a crm business case, record 12 months of baseline metrics and price every cost line for three years. Pick three to five measurable benefit lines. Show the payback month, a sensitivity test and the owner of each benefit. Leadership approves numbers it can check.
Should a CRM ROI case study guide your estimate?
A crm roi case study is useful for ideas about which benefit lines to count. It should not set your estimate. Published studies usually describe larger firms, vendor-selected customers and well-run projects. Use your own baseline, then check whether your result falls inside the published range.
Does CRM ROI change over three years?
Yes. CRM ROI over three years usually starts negative, turns positive in year two, and peaks in year three. One-off implementation costs fall away after year one, while benefits grow as adoption rises. That pattern is why a single-year view understates the return.
How Can Unboxx Help You Prove CRM ROI?
Unboxx builds the CRM ROI model with your finance and sales leads before configuration starts. The team records the baseline and prices every line for Salesforce, HubSpot, Microsoft Dynamics 365 or Odoo. Review points are set next, and delivery follows a phased CRM implementation plan.
For a new CRM, or one whose return is in doubt, schedule a consultation with Unboxx. The session reviews your current crm roi assumptions and shows where the gaps are.
Let's create something out of this world together.
Have a project in mind? Contact us for expert design and development solutions. Let's discuss how we can help grow your business.
Ready to Unboxx Your Potential?
Build smarter systems. Automate faster. Scale confidently.