
CRM Dashboard: Types, KPIs, Platform Limits and Build Steps
Sales leaders open their CRM every Monday and ask the same question: which numbers can the team trust?
Validity surveyed 602 CRM users and admins for its State of CRM Data Management report (2025). In that survey, 76% said less than half of their CRM data is accurate and complete.
A CRM dashboard is a single screen of charts showing live metrics such as pipeline, win rate and case volume. A good one turns records into a weekly decision.
This guide covers how it works and which KPIs belong on it. It also covers limits in Salesforce, HubSpot and Dynamics 365, plus a build plan.
Key Takeaways
- A dashboard is a set of report charts that answers one team's recurring decision.
- Each platform caps components, filters and sharing, so plan the layout before building.
- Dashboard accuracy depends on clean records, required fields and one owner per metric.
What Is a CRM Dashboard?
A CRM dashboard is a visual page inside a CRM that groups charts, tables and metric tiles. Each element is built from CRM reports. Each chart reads from a saved report.
The page refreshes to show current figures for one audience, such as a sales manager or a service lead.
Some teams call it a dashboard CRM view, and analysts call it a customer relationship management dashboard. Whatever the name, the job is to show the few numbers a team needs before it acts.
How Does a CRM Dashboard Differ From CRM Reporting?
CRM reporting produces lists and summaries of records, such as every open deal over $50,000. A report answers a single question in detail. A dashboard places 6 to 25 of those answers side by side. A reader then sees trends and exceptions together.
Reports remain the source of truth. One wrong report filter breaks every chart built on it, which is why dashboard work starts with the reports underneath.
What Is a Typical CRM Dashboard?
A typical dashboard for a B2B sales team holds 6 to 10 components. Common examples are pipeline by stage, deals closing this quarter, win rate by rep and activity counts. One metric tile usually shows quota attainment against the target.
The clearest way a CRM dashboard helps a business is time. Managers stop assembling figures from spreadsheets before each meeting. Stalled deals show up while there is still room to act.
How Does a CRM Dashboard Work?
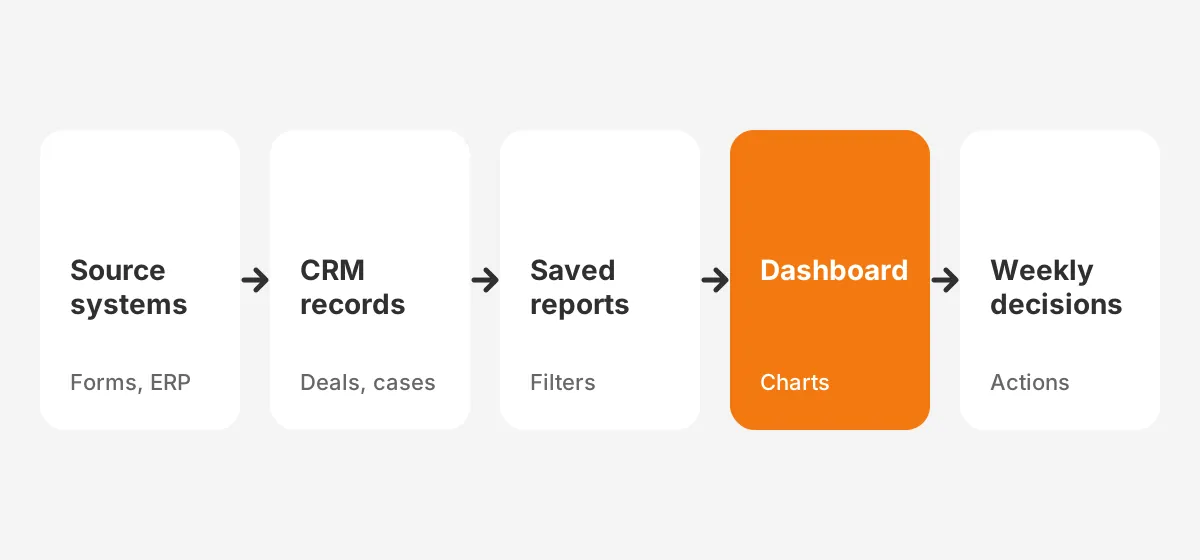
It works by running saved reports against CRM records and drawing each result as a chart. Data enters the CRM from forms, email sync, integrations and manual entry. Reports filter and group that data, and the dashboard displays the grouped results.
The chain has four links: source systems, CRM objects, reports and the dashboard itself. A break in any link shows up as a wrong number on screen. A CRM analytics dashboard in Power BI follows the same chain. It adds a data model in the middle.
What Feeds the Data Behind the Charts?
Records feed every chart, so the input methods matter. Web forms create leads, reps update opportunities, and integrations push orders from ERP systems. Activity tools such as Einstein Activity Capture log emails and meetings from Gmail or Outlook automatically.
Error rates differ by source. Typed fields drift, while synced fields stay consistent, so a CRM administrator should know where each dashboard field comes from.
Where Does CRM Analytics Fit?
CRM analytics covers deeper analysis than native dashboards, such as trend models and cross-object joins. Salesforce sells CRM Analytics as a separate product, and Microsoft pairs Dynamics 365 with Power BI. Native dashboards suit daily operations. Analytics tools suit quarterly questions that span two or more data sources.
Which Types of CRM Dashboards Do Teams Need?
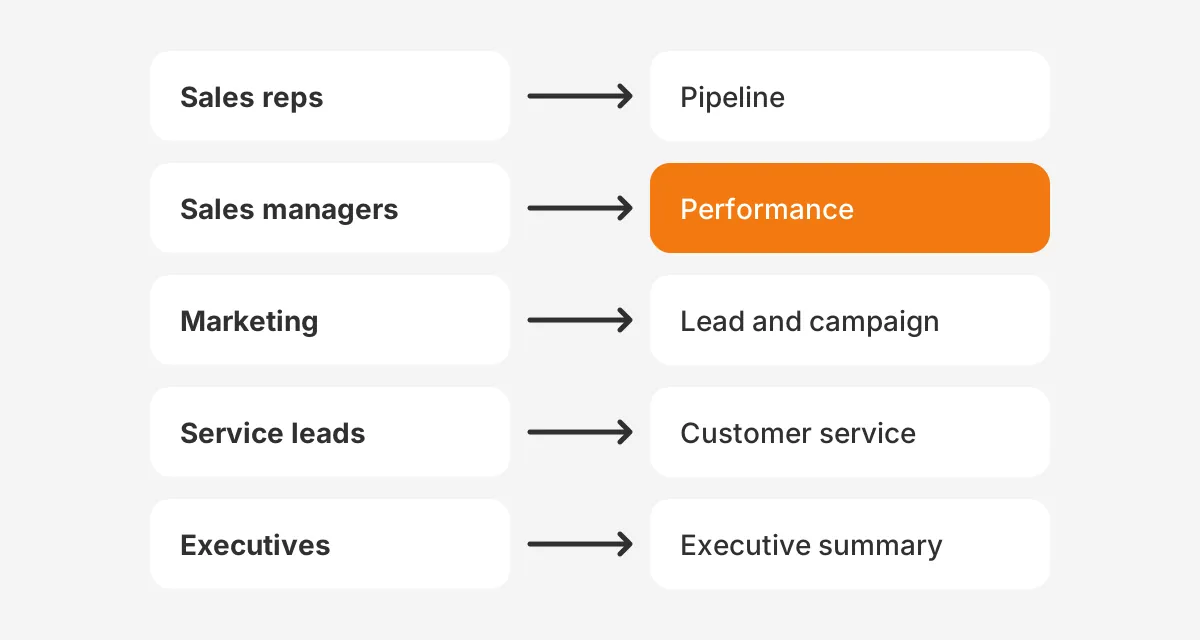
Plan one dashboard per recurring decision, usually grouped by role. Five types cover most B2B companies: sales pipeline, sales performance, marketing, customer service and executive. The CRM dashboard examples below show what each one tracks and who reads it.
What Does a Sales CRM Dashboard Show?
A sales CRM dashboard shows open pipeline, stage movement and deals at risk. The sales pipeline dashboard version gives managers pipeline visibility by stage, owner and close date. It supports sales pipeline management in weekly forecast calls.
A sales performance dashboard compares reps on win rate, average deal size and activity. Used together, these two views show how to prioritize leads and deals with CRM dashboards. Reps work the deals that are both large and moving.
How Do You Build CRM Dashboards for Marketing Teams?
Build CRM dashboards for marketing teams around lead flow and sourced revenue. A marketing dashboard tracks new leads by source, lead conversion rate to opportunity and pipeline created by campaign. Revenue reporting by campaign needs campaign attribution fields set on every opportunity.
What Belongs on Service and Executive Dashboards?
A customer service dashboard tracks open cases, first response time and case backlog by age. It can add net promoter score where surveys exist. An executive dashboard rolls up bookings, pipeline coverage, forecast and churn on one page. Because executives read it monthly, it needs fewer charts and clearer targets.
How Do Dashboards Support the Weekly Forecast Call?
Dashboards support the forecast call by putting the same figures in front of every attendee. The manager opens the pipeline view and filters to deals closing this quarter. Each rep then explains changes in stage, amount or close date since last week.
Nobody builds slides the night before. Deals that slipped quietly become visible, because the close date history sits on the same screen. Over a quarter, the call becomes shorter and the forecast becomes easier to defend.
These sample CRM dashboards are starting points, not rules. Treat each crm dashboard sample as a list of questions, then keep only the charts your team uses. The best ideas for a CRM dashboard come from the decisions in your meetings.
A sales dashboard built without that link gets ignored within weeks. A CRM dashboard example from another company shows layout, but your stages and targets decide the content.
Which CRM KPIs Belong on a CRM Dashboard?
The CRM KPIs that belong here are the ones tied to a weekly decision the reader makes. A KPI dashboard with 30 tiles hides the 5 that matter. Pick metrics that a named person owns and can change.
The table below lists common CRM metrics, what each one measures and who owns it. It doubles as a starting list for a CRM KPI dashboard or a sales KPI dashboard.
| KPI | What it measures | Typical owner |
|---|---|---|
| Pipeline coverage | Open pipeline divided by remaining quota | Sales manager |
| Win rate | Closed-won deals divided by all closed deals | Sales manager |
| Average deal size | Closed-won revenue divided by deals won | Sales leader |
| Sales cycle length | Days from opportunity creation to close | Sales operations |
| Lead conversion rate | Share of leads that become opportunities | Marketing |
| Forecast accuracy | Forecast compared with actual bookings | Sales leader |
| Customer churn rate | Share of customers lost in a period | Customer success |
Mix leading and lagging indicators. Bookings and churn are lagging: they report what already happened. Pipeline created, meetings booked and stage movement are leading: they predict next quarter. A page with only lagging metrics explains the past but gives a manager nothing to change this week.
How Do You Track Performance Using CRM Dashboards?
Track performance using CRM dashboards by pairing each metric with a target and a time period. A win rate of 22% means little alone. A win rate of 22% against a 25% target, for this quarter, tells a manager where to look.
Here is a worked example with assumed figures. A team has a $500,000 quarterly quota and $1,500,000 in open pipeline. Pipeline coverage is 3x. At a 25% win rate, that pipeline should produce about $375,000. The sales forecast therefore flags a $125,000 gap.
The same dashboard should show sales cycle length. If deals take 90 days to close, pipeline created this month cannot fill this quarter's gap. That one chart changes where reps spend the next three weeks.
How Do Salesforce, HubSpot and Dynamics 365 Dashboards Compare?
Salesforce, HubSpot and Dynamics 365 dashboards all build on saved reports, but each platform sets different limits. Knowing those limits before the build avoids a redesign later. The table below sums up the documented limits.
| Platform | Components per dashboard | Filters and views | Sharing |
|---|---|---|---|
| Salesforce | Up to 25, of which up to 20 report charts | Up to 5 filters, 50 values each | Folder access; dynamic dashboards capped by edition |
| HubSpot | Report limit set by subscription | Dashboard-wide or per-report filters | Private, everyone, or specific teams on Enterprise |
| Dynamics 365 | Up to 6 components | Standard or interactive dashboards | Security roles and sharing |
What Limits Apply to a Salesforce CRM Dashboard?
A Salesforce CRM dashboard can show up to 25 components, of which up to 20 can be report charts. That figure comes from a Salesforce Ben guide to creating dashboards (2025). The same guide states that a dashboard takes up to 5 filters with 50 values each.
Salesforce dashboard filters let one dashboard serve each region or product line. Dynamic dashboards in Salesforce run as the viewing user, so each rep sees only their own records. Salesforce Ben notes that dynamic dashboards are limited to ten, five or three per org, depending on edition.
Salesforce reports and dashboards share folder permissions. On Salesforce CRM dashboards, access problems often surface before design problems do. Set folder access for the team before the first build.
How Do HubSpot Dashboards Handle Limits and Sharing?
A HubSpot CRM dashboard holds a set number of reports that depends on the subscription. The HubSpot Knowledge Base (updated 2026) also states that a note added to a dashboard counts toward that limit. Dashboards cannot load reports with more than 100 values in the breakdown property.
Sharing options include private to owner, everyone with view or edit access, and specific users and teams on Enterprise. Teams on HubSpot free CRM still get customizable dashboards, but with tighter report limits. Check the HubSpot product catalog for the exact count before planning a large HubSpot dashboard.
HubSpot also lets users email a dashboard to a team member from the share menu. That option suits leaders who read figures in their inbox rather than inside the CRM. Pair it with filters, so each recipient sees the region or team they manage.
How Do You Build Dynamics 365 Dashboards?
To create a dashboard in Microsoft Dynamics CRM, open the model-driven app designer. Then choose a layout and add charts or views. According to Microsoft Learn (2026), up to six components can be included in a dashboard. Layout options include 2-column, 3-column and 4-column overviews, plus Power BI embedded.
A Dynamics 365 dashboard comes in two forms. A standard dashboard holds unrelated components such as charts and lists. An interactive dashboard lets users act on a row directly, which suits service queues. Charts read from Microsoft Dataverse tables.
What Are the Steps to Build a CRM Dashboard?
You build one by defining the decision first, then the metrics, reports, layout and access. Building charts first and asking questions later produces a cluttered page. The five steps below work in Salesforce, HubSpot, Dynamics 365 and Odoo.
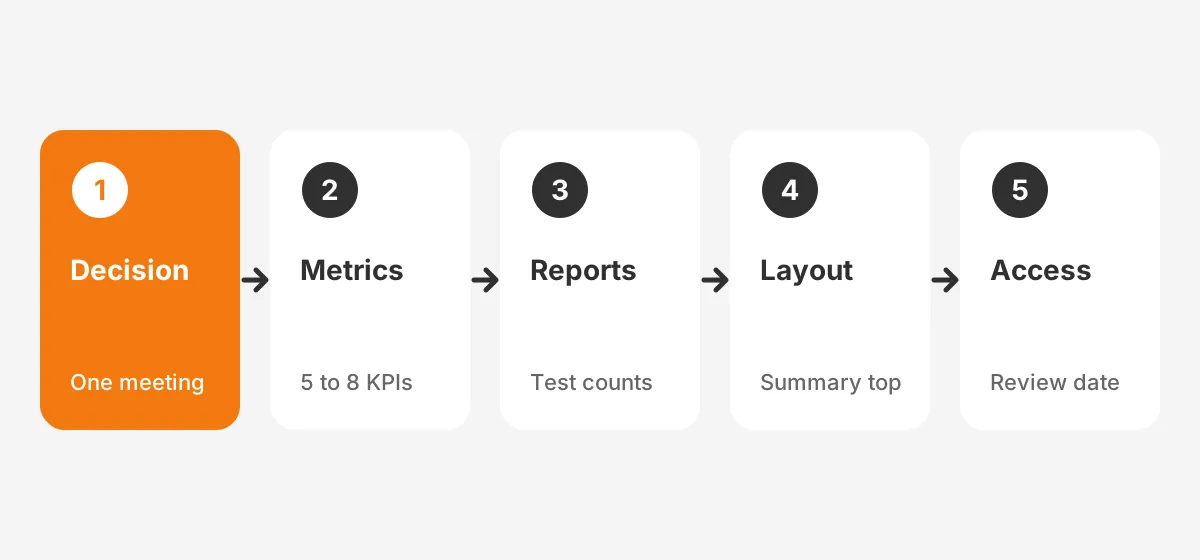
- Name the decision and the audience, such as the weekly forecast call for sales managers.
- List 5 to 8 metrics that inform that decision, each with one owner and one target.
- Build or fix the source reports, and test each report against a known record count.
- Arrange the layout with the most important metric top left and related charts together.
- Set access and a scheduled refresh, then book a 30-day review of chart use.
Should You Start From a CRM Dashboard Template?
A CRM dashboard template saves time on layout, but it rarely matches your stages and fields. Salesforce AppExchange and HubSpot both offer CRM dashboard templates. Use one as a wireframe, then rebuild each chart on your own reports.
That is how to create a CRM dashboard without importing someone else's definitions. A template built for 6 opportunity stages breaks when your process has 8.
How Should the Layout Read?
The layout should read from summary to detail, left to right and top to bottom. Put metric tiles in the first row, trend charts in the second and detail tables last. Use one color for the metric to watch and grey for context.
What Makes CRM Dashboard Data Trustworthy?
Dashboard data is trustworthy when records are complete, definitions are written down and each metric has an owner. Without those three, managers argue about numbers instead of acting on them. CRM data quality is the foundation, not a later fix.
Validity surveyed 600+ CRM admins for its State of CRM Data Management report (2024). Of those admins, 24% said less than half of their data is accurate and complete.
In the same report, 31% said poor-quality data costs at least 20% of annual revenue.
Which Controls Keep Dashboard Numbers Accurate?
Four controls keep dashboard numbers accurate. Required fields stop reps from saving opportunities without a close date or amount. A validation rule blocks impossible values, such as a close date in the past on an open deal.
Picklists replace free text for stage, source and loss reason. Duplicate rules stop the same account from splitting revenue across two records. The guide to CRM data cleansing covers how to fix records already in the system.
Why Write Down Metric Definitions?
Written definitions stop two teams from reporting two different win rates. Marketing may count a lead as qualified at form fill, while sales counts it after a discovery call. Both numbers are correct under their own rules. The conflict appears only when both land on one executive page.
Keep a one-page glossary for every metric on the screen. Record the formula, the report it uses, the date field and the owner. Link the glossary from the dashboard description so readers can check it.
How Does Activity Capture Affect the Numbers?
Automatic activity capture raises activity counts because it logs emails reps forget to enter. Einstein Activity Capture in Salesforce syncs emails and events from connected inboxes. Compare activity charts before and after switching it on, or the trend line will mislead readers.
Validity's 2025 report found workers spend 13 hours per week hunting for basic information in the CRM. Clean, automatic capture cuts that search time and fills the dashboard with data reps never had to type.
What Are the Most Common CRM Dashboard Mistakes?
The most common mistakes are excess charts, undefined metrics and no owner. Each one makes a dashboard harder to trust. Six mistakes come up again and again, each with a direct fix.
- Chart overload: a page with 20 tiles has no priority, so cap it at the metrics the meeting uses.
- Vanity metrics: total logged calls rise with activity capture, so pair activity with outcomes.
- Undefined terms: write down what counts as a qualified lead or a closed deal.
- Wrong date field: created date and close date tell different stories, so label which one each chart uses.
- No refresh plan: set refresh timing to match the meeting the dashboard serves.
- No review: remove any chart nobody opened in 30 days.
Access settings cause a quieter failure. A manager who sees all regions and a rep who sees one region read different totals from the same page. Label which records each viewer sees, and test the page while logged in as a rep before launch.
How Do You Choose a Good CRM Dashboard Design?
To choose a good CRM dashboard design, test it against one meeting. If the team can run the meeting from the page alone, the design works. Dashboard design best practices follow from that test: fewer charts, consistent colors and clear labels.
Low adoption is often a sign of a poor fit. The CRM adoption guide explains how to get reps using the system that feeds the dashboard. A dashboard nobody opens has no value, however accurate it is.
For the build itself, Unboxx CRM consulting and implementation services cover reports, dashboards and data rules. Teams on Salesforce can also use Salesforce CRM Analytics consulting for cross-object analysis.
Frequently Asked Questions
Who should own a CRM dashboard?
A business owner should own each dashboard, with a CRM administrator maintaining it. The sales leader owns the forecast dashboard and decides which metrics stay. The administrator fixes reports, filters and access. This split keeps decisions with the business and technical upkeep with the CRM team.
When should a CRM dashboard refresh?
It should refresh before the meeting it serves. A daily stand-up needs morning data, and a weekly forecast call needs a refresh before the call. Salesforce and HubSpot let users refresh on demand. Match the refresh schedule to the decision cadence, not to the fastest available option.
Which CRM has customizable dashboards?
Salesforce, HubSpot, Microsoft Dynamics 365 and Odoo all have customizable dashboards. They differ mainly in limits. Salesforce allows up to 25 components per dashboard, while Dynamics 365 allows up to six. HubSpot sets its report limit by subscription tier, so plan layouts with that limit in view.
Can Power BI work as a CRM dashboard?
Power BI can work as a CRM dashboard when data from the CRM is combined with ERP or finance data. A Power BI CRM dashboard needs a data connector and a data model. To connect CRM data with business dashboards, start with one object and one refresh schedule, then extend.
What number of metrics should a CRM dashboard show?
It should show only the metrics its audience uses for one recurring decision. For a weekly sales meeting that is often 5 to 8 metrics. Every extra chart competes for attention. Move detailed or rarely used metrics to a second dashboard or a saved report.
How Can Unboxx Help Build Your CRM Dashboard?
Unboxx builds each dashboard from the decision backward, starting with clean records and tested reports. The team works across Salesforce, HubSpot, Dynamics 365 and Odoo. See how Unboxx approached fixing unreliable Salesforce reports with RevOps administration. The CRM ROI guide covers how to measure returns.
When the current CRM dashboard shows numbers nobody trusts, the fix usually starts below the charts. Schedule a consultation with Unboxx to review your reports, fields and layout.
Let's create something out of this world together.
Have a project in mind? Contact us for expert design and development solutions. Let's discuss how we can help grow your business.
Ready to Unboxx Your Potential?
Build smarter systems. Automate faster. Scale confidently.