
CRM Reporting: Core Reports, Build Steps and Data Trust
A sales director opens the Monday pipeline report and sees $4.2 million in open deals. Finance sees $3.1 million in its own spreadsheet. The meeting turns into an argument about whose number is right.
Gaps like this are common. The Validity State of CRM Data Management 2025 surveyed 602 CRM users. Of those, 76% said less than half of their CRM data is accurate and complete. When CRM reporting goes wrong, the cause is usually the data, not the software.
CRM reporting is the practice of turning the records in a CRM into reports that answer business questions. Those questions cover pipeline, revenue, activity, campaigns and service. Good CRM reporting starts with the decision a report supports. The fields, filters and owners behind it then make the number reliable.
Key Takeaways
- CRM reporting works when each report answers one named business question for one named owner.
- Salesforce, HubSpot and Dynamics 365 each build reports differently, with limits a buyer should know first.
- Trust in CRM reports depends on entry rules and field definitions more than on the reporting tool.
What Is CRM Reporting?
CRM reporting is the process of pulling CRM records into structured views that show performance and trends. A CRM report is the single output, such as a list of open deals grouped by stage. CRM reporting is the whole practice around those outputs, including design, review and upkeep.
Every report has the same four parts. A data source defines which records it reads, such as deals, contacts or cases. Fields define the columns. Filters define which records count. Grouping and visualization define how the result is shown, from a plain table to a bar chart.
CRM data reporting differs from accounting reports in one key way. The CRM holds records that sales and service staff type in during the working day. A report is only as good as that data entry. Customer relationship management reporting therefore depends on people as much as on software.
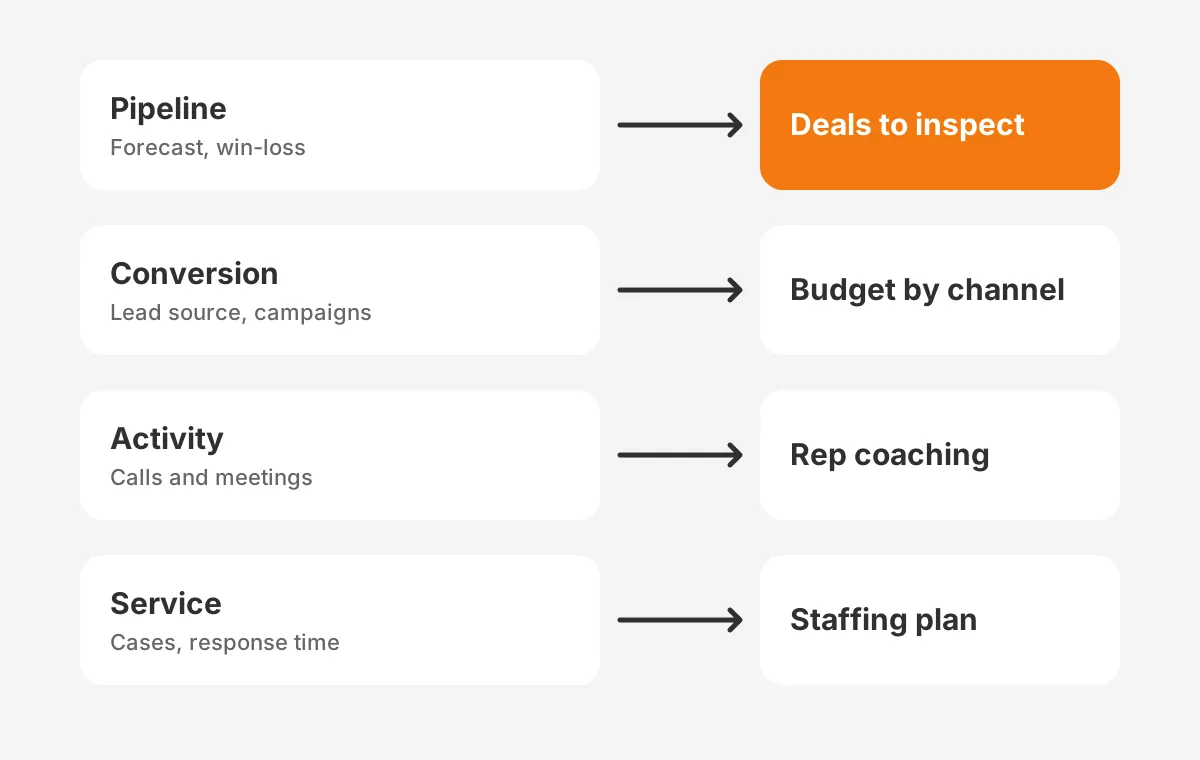
The purpose is decisions, not decoration. A sales manager uses a pipeline report to decide which deals to inspect this week. A marketing lead uses a lead source report to decide where next quarter's budget goes. A service manager uses a first response time report to decide on staffing.
How Is CRM Reporting Different From a Dashboard?
A CRM report answers one question in detail. A dashboard shows the headline figures from a set of reports on one screen. In Salesforce and HubSpot, dashboards are built from saved reports. The report holds the logic, and the dashboard only displays its result.
The split matters when numbers disagree. A dashboard tile that looks wrong is fixed in the report behind it. Editing the dashboard instead tends to create two versions of the same metric.
The Unboxx guide to building a CRM dashboard by role covers the display layer in depth.
CRM reports vs dashboards also differ in audience. Reports suit analysts and managers who filter and drill into rows. Dashboards suit executives who scan five numbers in two minutes. Strong CRM reporting needs both layers, built in that order: report first, dashboard second.
Which CRM Reports Does Every B2B Team Need?
A practical core set for B2B teams is eight CRM reports covering pipeline, forecast, conversion, activity and service. The table lists the types of CRM reports found in nearly every working setup. Each row shows the question and the owner.
| Report | Question it answers | Typical owner |
|---|---|---|
| Sales pipeline report | How much open value sits in each stage? | Sales manager |
| Sales forecast report | What will close this quarter? | Sales director |
| Win-loss report | Which deals are won or lost, and why? | Sales director |
| Lead source report | Which channels create qualified leads? | Marketing lead |
| Sales activity report | Are reps doing the calls and meetings the plan needs? | Sales manager |
| Campaign performance report | Which campaigns turn into pipeline? | Marketing lead |
| Customer retention report | Which accounts renew, expand or churn? | Account management |
| Customer service report | How fast are cases answered and closed? | Service manager |
The sales pipeline report is the starting point for most teams. It groups open deals by stage and shows pipeline value, deal count and age. A useful version also flags deals with no activity in 14 days. That filter shows stalled deals the totals hide.
The sales forecast report adds probability or forecast category to the pipeline. It depends on reps updating close dates, so it rewards strict entry rules. A win-loss report needs a required loss reason field. Without that field, the report counts losses but cannot explain them.
Marketing ties to revenue through the lead source report and the campaign performance report. Both need a clean lead source value captured at the first touch. Multi-touch questions belong in revenue attribution models and setup.
After the sale, a churn report and a customer retention report serve the account team. They show which accounts renew, which expand and which slip away.
Sales performance reports usually combine these views by rep or team. The metrics inside them are win rate, lead conversion rate, sales cycle length, average deal size and pipeline value. Each KPI needs a written definition, which the next section covers.
What Metrics Belong in CRM Reporting?
CRM reporting should track a short list of metrics that each tie to a decision, usually eight to twelve. Each metric needs a formula, a date field and fixed filters. Without those three parts, two people can report the same KPI and get different answers.
| Metric | Formula | Date field to use |
|---|---|---|
| Win rate | Closed-won deals divided by all closed deals | Close date |
| Lead conversion rate | Leads that became opportunities divided by all new leads | Lead created date |
| Sales cycle length | Average days from opportunity created to closed-won | Close date |
| Pipeline value | Sum of open deal amounts, by stage | Snapshot date |
| Average deal size | Closed-won amount divided by closed-won deal count | Close date |
| First response time | Median time from case created to first reply | Case created date |
The date field causes more disputes than the formula. Win rate by created date and win rate by close date answer different questions. Pick one per metric, write it down and use it in every CRM report that shows that metric.
A first response time report needs a choice between median and average. One slow case can drag an average far above the typical experience. The median shows what most customers see, so it suits service staffing decisions better.
Ratios need a minimum sample too. A win rate built on four closed deals swings by 25 points with each new result. Set a floor, such as 20 closed deals, before a ratio appears in a management review. Below that floor, show the raw counts instead.
Keep vanity metrics out of CRM reporting. Counts of emails sent or records created rarely change a decision. They reward activity over outcomes and crowd the report library. If a metric would not change what a manager does next week, leave it out.
Who Uses CRM Reports, and for What Decisions?
Sales managers, directors, marketing leads, service managers and RevOps teams all use CRM reports, each for a different decision. Mapping users to decisions keeps the report library small. A report with no decision behind it tends to sit unread.
- Sales reps use activity and pipeline lists to plan their day and update next steps.
- Sales managers use pipeline and activity reports in weekly one-to-one reviews.
- Sales directors use forecast and win-loss reports for quarterly commits and pricing calls.
- Marketing leads use lead source and campaign reports to shift budget between channels.
- Service managers use case volume and response time reports to plan staffing.
- RevOps or the CRM admin owns definitions, report folders and data quality checks.
CRM reporting for sales managers deserves the most care, because weekly reviews run on it. A manager needs the same report, with the same filters, every week. Changing filters between meetings makes trends impossible to read.
Executives sit at the top of this chain and rarely open a CRM report directly. They read dashboards, board slides or exports built from the reports above. When an executive questions a number, the trail should lead back to one named report and one named owner.
How Does CRM Reporting Work in Salesforce?
CRM reporting in Salesforce starts with a report type, which defines the objects and fields a report can read. A standard report type such as Opportunities exposes deal fields. Admins can create custom report types when a report needs related objects that the standard types do not join.
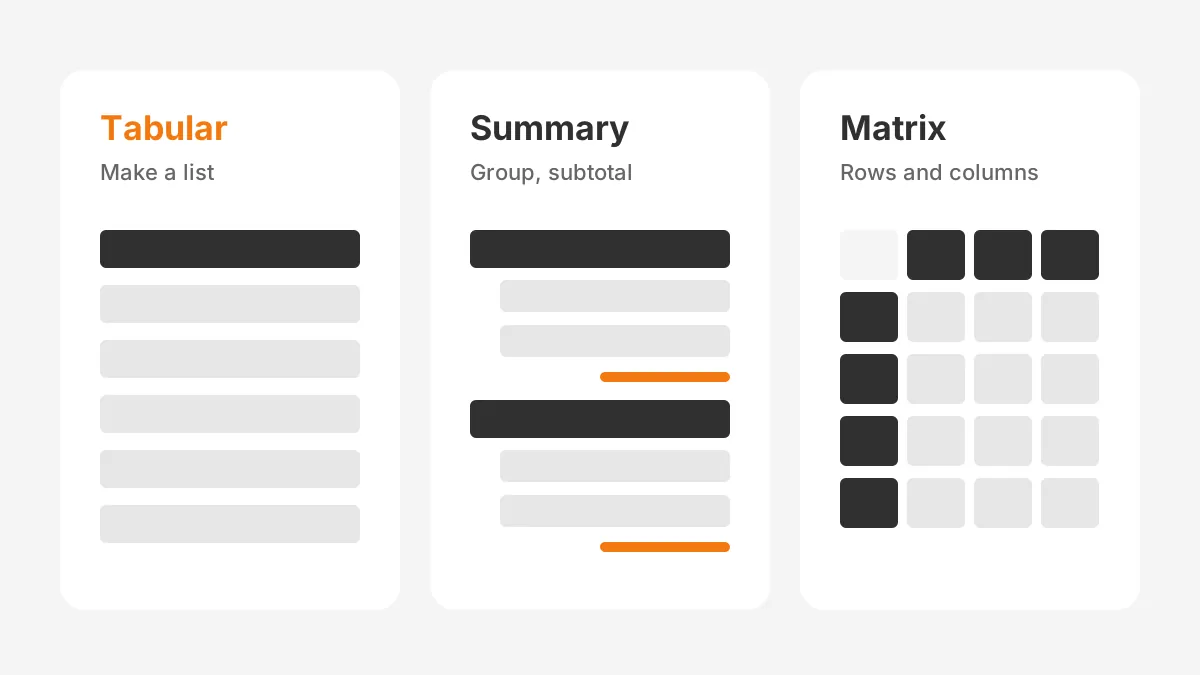
After the report type, the builder chooses a report format. Salesforce Trailhead lists three formats: Tabular, Summary and Matrix. Tabular is the default.
- A tabular report lists records in rows and fields in columns, like a spreadsheet.
- A summary report groups rows, adds subtotals and supports charts.
- A matrix report groups records by both row and column.
Trailhead notes that matrix reports take the most time to set up but give the most detailed view. A common example is opportunity amount by owner down the side and close month across the top. That one matrix report can replace a monthly spreadsheet that someone rebuilds by hand.
Beyond the format, Salesforce reports take filters, bucket fields and row-level formulas. Filters decide which records count. A report filter on close date and stage is the most common source of disagreement between teams. Two reports that look identical can use different date filters and show different totals.
Visibility is a separate layer. Reports respect sharing settings, so two managers may run the same report and see different rows. That behavior protects data, but it confuses users who compare totals. Folder access and a short note in the report description prevent that confusion.
Older orgs pile up unused reports over the years. A periodic cleanup during a Salesforce optimization review removes duplicates and broken filters. Unboxx has done this work for clients whose reports had stopped matching reality, as in this Salesforce reporting cleanup story.
How Do You Build Reports in HubSpot?
HubSpot reports are built in the custom report builder, under Reporting, then Reports, then Create. The HubSpot Knowledge Base lists it for Professional or Enterprise subscriptions of its hubs. Users also need permission to create and edit reports.
HubSpot describes five steps for every custom report:
- Select the report's data sources, such as contacts, companies or deals.
- Add fields to the report.
- Set report filters.
- Configure the visualization, from bar chart to pivot table.
- Save or export the report.
That page also lists limits that shape report design. A single report holds up to 12 measures. Non-table reports are limited to 1,000 unique rows, while table reports page through more. A pivot table allows a maximum of four rows and four columns.
Timing catches people out. HubSpot states that new data takes 10 to 15 minutes to appear in reports. Reports refresh every two hours, and a manual refresh is allowed once every 15 minutes.
A manager who checks a report straight after a call may not see that call yet. Weekly reviews avoid the problem, since the data has long settled.
Prebuilt reports in the HubSpot report library suit teams in their first months. The custom report builder becomes necessary once a team needs to join deals with companies or with custom objects. Teams new to the platform should define their core reports during setup, not after go-live.
Deal reports in HubSpot often need the company and its owner joined in. Pick deals as the primary data source, then add companies as a second source. Keep the filter on deal close date, not company created date. That choice keeps the totals in line with the pipeline review.
What Reporting Options Does Dynamics 365 Offer?
Microsoft Dynamics 365 Sales offers lists and views, charts, dashboards, Advanced Find, Excel export and Power BI. Microsoft Learn describes lists and views as the easiest way to do basic analysis.
Charts in Dynamics 365 sit on top of views for record types such as leads and opportunities. Dashboards bring more than one record type into one interactive area.
For ad hoc questions, Advanced Find runs detailed searches across record types. Data can also go out to Excel for PivotTables and finer charting.
Power BI handles the heavier business intelligence work. Microsoft notes it can pull data from more than one source for advanced analysis. The "Visualize this view" button opens a Power BI visual from inside a Dynamics 365 view without leaving the app.
Before relying on an older setup guide, check the Dynamics 365 Sales deprecation list.
Microsoft states there that the Sales Analytics and Process Analytics template apps were deprecated effective May 2025. It also lists sales usage reports as deprecated effective December 1, 2025. Any guide built around those apps is now out of date.
The practical result is a two-layer model. Views, charts and dashboards cover daily work inside Dynamics 365. Power BI covers cross-system reporting, such as joining CRM pipeline with ERP invoices. Teams should decide early which numbers live in which layer.
A simple rule helps here. If a number comes only from CRM records, report it in the CRM. If it joins CRM data with finance or ERP data, report it in Power BI and label the source.
Why Do Teams Stop Trusting CRM Reports?
Teams stop trusting CRM reports when the data inside them is incomplete, duplicated or defined differently by each team. The Validity 2025 survey found that 37% of CRM users lost revenue as a direct result of poor data quality. Reporting tools cannot fix that on their own.
Four causes come up again and again in broken CRM reports:
- Missing values, such as deals with no close date or leads with no source.
- Duplicate records, which double count accounts and inflate pipeline.
- Loose definitions, where "qualified lead" means one thing to marketing and another to sales.
- Silent filter changes, where someone edits a shared report and nobody notices.
CRM data quality is an entry problem first. Required fields, picklists instead of free text, and validation rules stop bad data at the source. A scheduled cleanup removes what slips through. The Unboxx guide to CRM data cleansing steps covers duplicates and field standards in detail.
Definitions are the second fix. Write each KPI in one sentence, with its formula and filters. For example, win rate equals closed-won deals divided by all closed deals in the period. Store that definition in the report description, so every viewer reads the same rule.
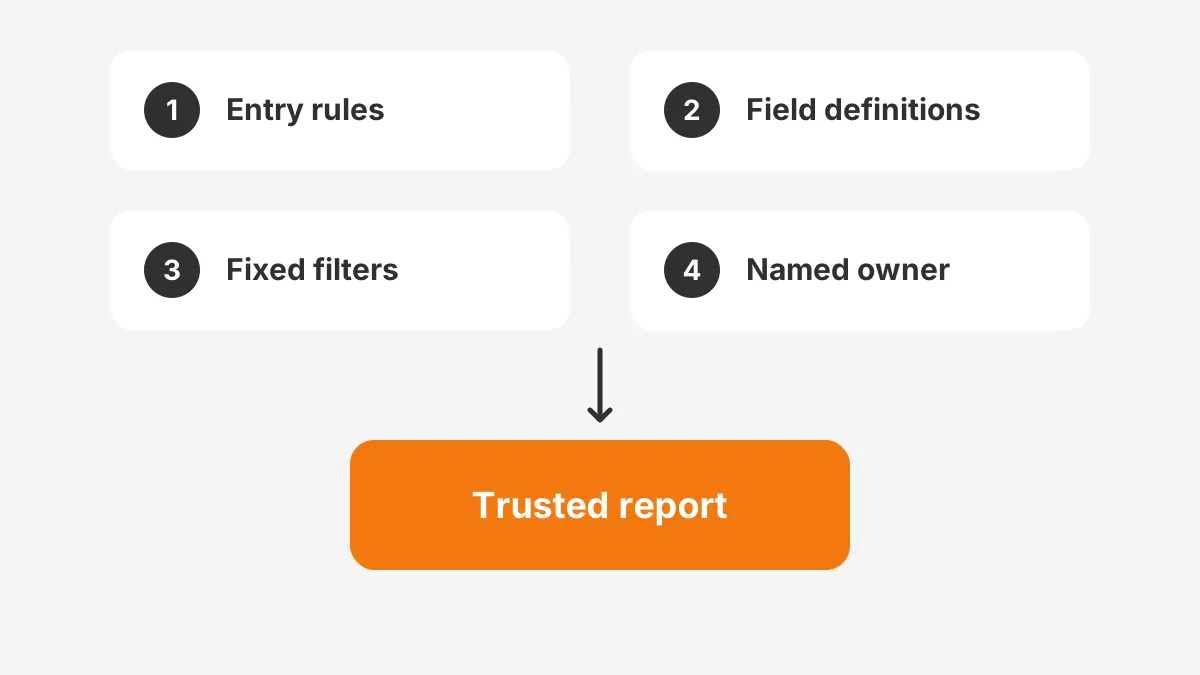
Ownership is the third fix. Every shared report needs one owner who approves changes. In practice that is the CRM admin or a RevOps lead. A quarterly CRM audit of fields and reports keeps them honest. It confirms that owners, filters and definitions still match how the business works.
How Do You Set Up CRM Reporting?
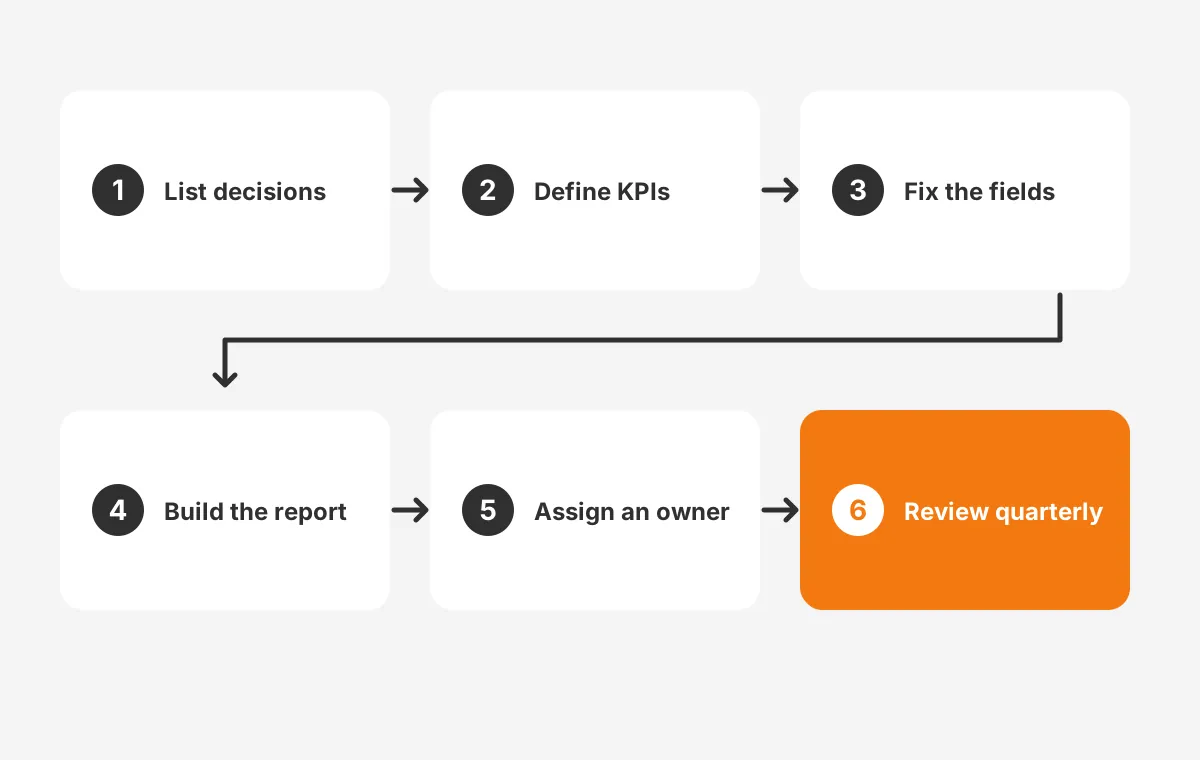
To set up CRM reporting, start from decisions, define the metrics, fix the data, then build and review reports. The six steps below apply to Salesforce, HubSpot and Dynamics 365 alike. They also work for a team rebuilding reports after a CRM migration.
- List the recurring decisions, such as weekly pipeline review or quarterly budget split.
- Write one KPI definition per decision, with formula, date field and filters.
- Check that every field the KPI needs exists, is required and holds clean values.
- Build the report in the simplest format that answers the question.
- Name an owner, set folder access and add the definition to the description.
- Review usage each quarter and retire reports nobody opened.
Here is a worked example with assumed figures. A 40-person B2B distributor runs 120 saved reports, but managers use 18 of them. The team keeps those 18, merges 6 near-duplicates and archives the rest. Weekly reviews then run on one pipeline report and one activity report.
The same example shows where data fixes pay off. In that assumed case, 22% of open deals had no close date. Making close date required at stage two removed the gap within one quarter. The forecast report became usable because the field behind it was finally complete.
CRM reporting best practices come down to restraint. Fewer reports, written definitions and named owners beat a large library of clever charts. Teams that want outside help can review the Unboxx CRM consulting and implementation services. They include CRM reporting design during setup and optimization.
Frequently Asked Questions
How often should CRM reports be reviewed?
Operational CRM reports, such as pipeline and activity, should be reviewed weekly by the managers who own them. Forecast and win-loss reports suit a monthly or quarterly review. The report library itself needs a quarterly check, so unused or broken reports get retired before they mislead anyone.
What is the best CRM for reporting?
The best CRM for reporting is the one whose data model matches how a team sells. Salesforce offers flexible report types and formats. HubSpot offers a guided custom report builder on paid tiers. Dynamics 365 pairs in-app views with Power BI for cross-system reporting needs.
Why is CRM reporting important for sales forecasting?
Sales forecasting depends on CRM reporting because the forecast is a report on open deals, stages and close dates. If reps skip those fields, the forecast drifts. A forecast report with required fields and fixed filters gives leaders a number they can commit to with confidence.
Can CRM data be exported to Excel for reporting?
Yes, CRM data can be exported to Excel from Salesforce, HubSpot and Dynamics 365. Excel helps with one-off analysis and pivot tables. Regular reporting should stay inside the CRM, though. Exported files go stale and break the link to one trusted source.
What skills does a CRM reporting owner need?
A CRM reporting owner needs working knowledge of the platform's report builder, the company's sales process and basic data hygiene. The role writes KPI definitions, approves report changes and runs quality checks. In smaller companies the CRM admin often holds this role alongside other admin work.
Where Should Your CRM Reporting Go Next?
CRM reporting should go next to the one decision your team argues about most, such as forecast or lead quality. Fix the definition and the fields behind that report first. Then extend the same rules to the other core reports, one at a time.
Unboxx designs and repairs CRM reporting on Salesforce, HubSpot and Dynamics 365 for B2B teams. Its consultants map decisions to reports, clean the fields behind them and hand over clear owners. Schedule a consultation to review your current reports.
Let's create something out of this world together.
Have a project in mind? Contact us for expert design and development solutions. Let's discuss how we can help grow your business.
Ready to Unboxx Your Potential?
Build smarter systems. Automate faster. Scale confidently.