
A marketing team reports 140 opportunities sourced this quarter. Sales says the same deals came from outbound calls and partner referrals. Finance asks which number is right, and nobody can answer from the CRM.
The Gartner B2B buying journey research puts a typical buying group at six to 10 decision makers. One source field per deal cannot describe that.
Revenue attribution settles that argument with a shared rule. It gives each marketing and sales touchpoint a share of credit for closed-won revenue. It ties campaigns to real deal amounts, not to clicks or form fills.
The model is rarely the hard part. Getting campaign, contact and deal records to connect is where projects stall.
Key Takeaways
- Revenue attribution credits closed-won deal amounts to the touchpoints that shaped each deal.
- The attribution model matters less than clean CRM data such as UTM fields, campaign members and contact roles.
- HubSpot and Salesforce both report attribution natively, but each has edition limits and data rules.
What Is Revenue Attribution?
Revenue attribution is a reporting method that splits the value of each won deal across the touchpoints that influenced it.
A touchpoint can be a webinar, an ad click, a sales call or a trade show visit. A case study email counts too. The output is a dollar figure per campaign, channel or asset.
Marketing attribution is the wider term and also covers clicks, leads and sign-ups. Counting only money that reached the bank makes the figures useful to a CFO, not only to a campaign manager.
Every revenue attribution report rests on three records. A touchpoint record says what happened and when. A contact record ties it to a person. The deal or opportunity record holds the amount, stage and close date.
When those three records connect, an attribution model decides how much credit each touchpoint earns. When one link breaks, the report quietly drops revenue. That is why most attribution projects are data projects first and reporting projects second.
Why Does Revenue Attribution Matter for B2B Teams?
Revenue attribution matters because B2B deals involve long sales cycles, buying groups and dozens of interactions. A single lead source field cannot describe that journey. Budget decisions made on lead counts often fund the channels that produce cheap leads rather than closed revenue.
The same Gartner research found that buyers spend only 17% of their buying time meeting potential suppliers. Most of the buyer journey happens away from sales calls, in research the CRM never sees directly. Credited revenue is the closest a CRM gets to measuring that hidden part of the journey.
A working revenue attribution report answers four practical questions:
- Which campaigns appear most often in closed-won deals?
- Which channels start deals, and which channels close them?
- How much pipeline and revenue did each program influence this quarter?
- Where should the next dollar of marketing budget go?
It also aligns marketing and sales. Both teams agree on one model before the quarter starts. The debate then shifts from whose number is right to what the data says.
That alignment is why revenue operations teams often own attribution in mid-sized companies. Our AI growth marketing services start with this agreement before any dashboard work begins.
Attribution is also the input for marketing ROI. Without credited revenue, ROI uses leads or pipeline as a proxy. The marketing automation ROI guide shows how credited revenue feeds the formula.
What Are the Main Revenue Attribution Models?
The main revenue attribution models are first-touch, last-touch, linear, time-decay, position-based and data-driven. Each one answers a different question about the buyer journey. Single-touch models give all credit to one interaction, while multi-touch attribution models split credit across every interaction they count.
| Model | How credit is split | Best question it answers | Main weakness |
|---|---|---|---|
| First-touch | 100% to the first interaction | Which channels create new demand? | Ignores everything after discovery |
| Last-touch | 100% to the final interaction before the deal | Which channels convert ready buyers? | Ignores early awareness work |
| Linear | Equal share to every interaction | Which campaigns appear across journeys? | Treats a newsletter open like a demo |
| Time-decay | More credit to recent interactions | What moved deals in the final weeks? | Undervalues first touches in long cycles |
| Position-based (U-shaped or W-shaped) | Most credit to key milestones, the rest spread | Which touches created leads and deals? | Fixed weights are a guess |
| Data-driven | Weights learned from converting and non-converting paths | Which touches change the odds of winning? | Needs high deal volume and clean data |
First-touch attribution helps a team that needs to grow new demand. Last-touch attribution is the better lens for conversion efficiency. When nobody yet trusts the data, linear attribution is a fair place to start.
Time decay attribution favours the interactions closest to the deal.
Position-based models such as u-shaped attribution and w-shaped attribution weight key milestones. Those milestones are the first touch, the lead conversion and the opportunity creation. Data-driven attribution uses statistics to learn the weights, so it needs a large history of won and lost deals.
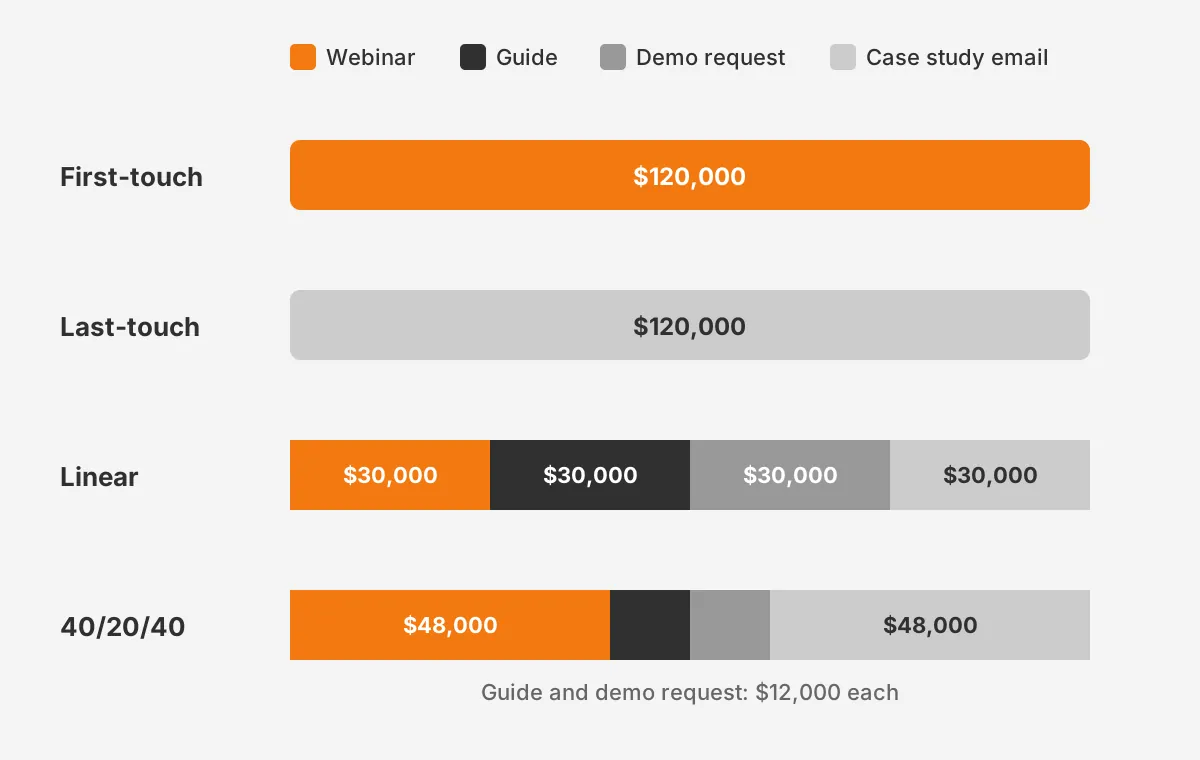
Here is a revenue attribution example with assumed figures. A $120,000 deal had four touches: a webinar, a guide download, a demo request and a case study email. First-touch gives the webinar $120,000. Last-touch gives the case study email $120,000. Linear gives each touch $30,000.
A 40/20/40 position-based split, used here as an example weighting, gives the webinar $48,000 and the case study email $48,000. The guide download and the demo request get $12,000 each. Same deal, four different stories about what drove it.
How Do You Choose a Model by Team Stage?
Choose the model by the decision the team must make next. A company with fewer than 50 closed deals a year should start with first-touch and last-touch side by side. Those two models are simple to explain and easy to audit by hand.
A team with a stable data chain and steady deal flow can move to linear or a position-based model. A team with large deal volume, clean history and lost-deal data can test data-driven attribution. Each step up needs better data than the last.
There is no fixed answer to which attribution model is best. Pick the model that answers the leadership team's most common budget question. Then report one other model beside it as a check.
How Is Revenue Attribution Different From Lead Attribution?
Lead attribution credits touchpoints for creating a lead or contact, while revenue attribution credits them for closed-won money. The two often disagree. A paid social campaign can create thousands of cheap leads and almost no revenue.
Lead attribution is faster to measure because leads arrive within days. Revenue attribution waits for the sales cycle to finish, which often runs for months in B2B. Most teams track both and read them together.
A third measure sits between them. Pipeline attribution credits touchpoints for opportunities created, weighted by the opportunity amount. It gives earlier feedback than closed revenue while still tracking deal value.
Two related terms cause confusion. Sourced revenue is revenue from deals where marketing created the first touch. Influenced revenue is revenue from deals where marketing touched any contact at any stage. Influenced revenue is always the larger figure, so reports should name which one they show.
What CRM Data Does Revenue Attribution Need?
Revenue attribution needs five types of CRM data: campaign tags, touchpoint records, contact associations, deal amounts and close dates. Missing any one of them removes deals from the report without warning. CRM data quality, more than model choice, decides whether the numbers hold up.
UTM parameters are the starting point for digital touches. Google Analytics URL builder guidance says every tagged link should carry utm_source, utm_medium and utm_campaign. It also notes that values are case sensitive, so "LinkedIn" and "linkedin" become two separate sources.
UTM tracking only helps when the values land in the CRM. Hidden form fields or the marketing platform's tracking script must copy them onto the contact record. Set a written naming convention and keep a shared list of allowed values.
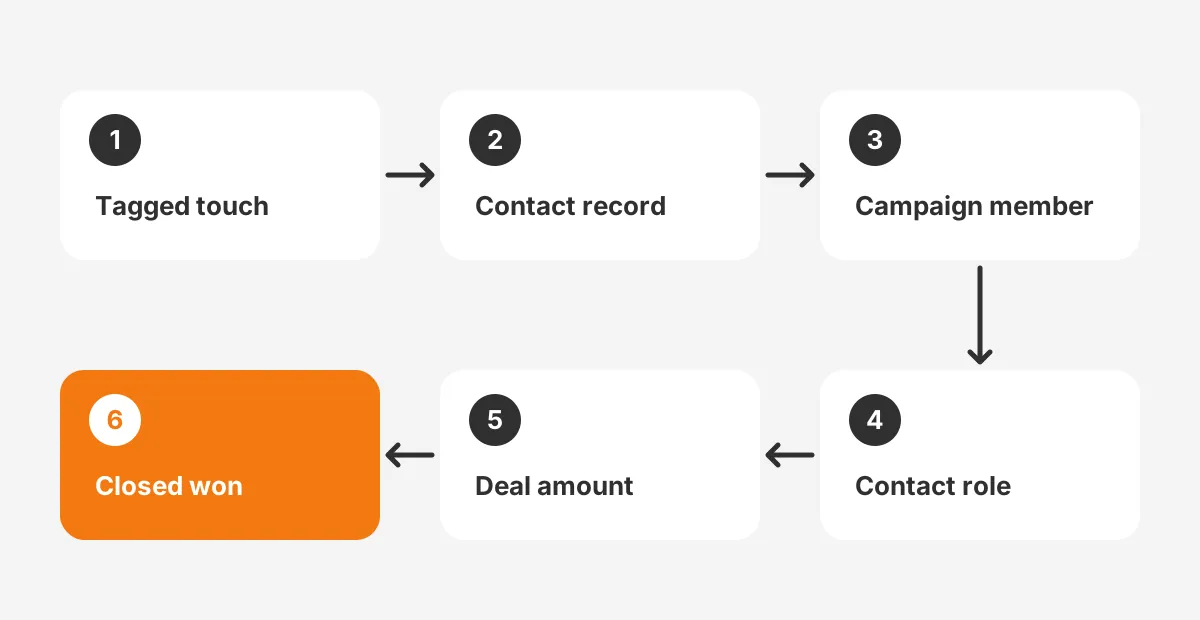
The data chain for one deal follows six links:
- A tagged link or event list records the touchpoint.
- The form or import attaches the touchpoint to a contact.
- The contact joins a campaign as a campaign member.
- The contact is added to the deal, ideally with a role.
- The deal carries an amount and a create date.
- The deal closes won with a close date.
Keep a short field list for the project. On the contact, store original source, latest source and the first-touch UTM values. On the deal, store amount, create date, close date and primary campaign. Lock each field to a picklist where the platform allows it.
Record the date of each change as well. A source field that sales reps overwrite after the first call loses the history attribution depends on.
Offline attribution needs extra discipline. Trade show scans, webinar attendee lists and partner referrals must be imported as campaign members with the correct date. Self-reported attribution, such as a "How did you hear about us?" field, can fill gaps that tracking misses.
Clean records matter as much as complete ones. Duplicate contacts split one buyer's history across two records. The CRM data cleansing runbook covers deduplication and field standards to fix before attribution starts.
How Does HubSpot Revenue Attribution Reporting Work?
HubSpot revenue attribution reporting uses the attribution report builder to credit interactions with contact creation, deal creation and closed-won revenue. According to the HubSpot attribution definitions page (updated June 2026), there are three report types. Deal create and revenue reports need Marketing Hub Enterprise.
The same page sets strict data rules for revenue reports. A deal is included only when it is closed won and has at least one associated contact.
It must also have known values in the Amount, Create date and Close date properties. Deals that miss any of these rules drop out silently.
HubSpot changed its model list in 2026. The HubSpot create attribution reports guide (updated August 2026) renames revenue attribution to Deal Revenue Attribution. It lists First Touch, Last Touch, Linear, Time Decay and an Empirical model. The page says Empirical replaces the U-shaped, W-shaped, J-shaped and inverse J-shaped models.
Three setup checks make HubSpot attribution reports reliable:
- Associate every deal with the buying contacts, not only the main contact.
- Make Amount and Close date required at the closed-won stage.
- Connect ad accounts and log sales emails and meetings so interactions are captured.
Contact create attribution and deal create attribution are useful early signals. Teams that score leads can compare these reports with their HubSpot lead scoring thresholds. The comparison shows whether high scores lead to revenue.
How Does Salesforce Campaign Influence Credit Revenue?
Salesforce campaign influence credits opportunity revenue to the campaigns that the opportunity's contacts joined. It works through campaign members and opportunity contact roles. If a contact is not on the opportunity, that contact's campaigns earn no credit.
The Salesforce Ben campaign influence guide (2025) describes two versions. The original version gives 100% of the credit to the campaign in the Primary Campaign Source field. Customizable Campaign Influence adds models and uses the contact role as the link between campaigns and opportunities.
The same guide names three out-of-the-box models: first-touch, last-touch and even distribution. Salesforce uses the campaign member created date to decide which campaign was first. The guide notes these additional models need both Salesforce and Account Engagement (Pardot) licences.
Before trusting campaign influence reports, confirm that:
- Sales reps add every buyer as an opportunity contact role.
- Campaign members are created for offline events, not only online forms.
- The influence time frame matches the real sales cycle length.
Sales activities need the same care. Calls, meetings and emails logged against the opportunity show where sales effort sat in the journey. Without them, every report overstates the share that marketing campaigns earned.
Teams choosing between the two platforms for this kind of reporting can compare them in the Pardot vs HubSpot comparison. Both can credit revenue to campaigns, but they store touchpoints differently.
How Do You Set Up Revenue Attribution?
To set up revenue attribution, agree the business question, fix the data, then build and test reports. The six steps below fit a mid-sized B2B team on HubSpot or Salesforce. As a planning estimate, a first trusted report often takes 8 to 12 weeks.
- Agree the question and the model. Write down the budget decision the report will support. Choose one primary model and one comparison model.
- Set the tracking rules. Publish a UTM naming convention and a campaign naming convention. Lock picklist values for channel and source.
- Fix the contact and deal data. Merge duplicates, make Amount and Close date required, and add contact roles to open deals.
- Capture offline touches. Import event, webinar and partner lists as campaign members with the correct dates.
- Build the reports. Create the revenue attribution report, a pipeline attribution report and a sourced revenue report.
- Test against closed deals. Pick 20 recent closed-won deals and check each touchpoint by hand against the report.
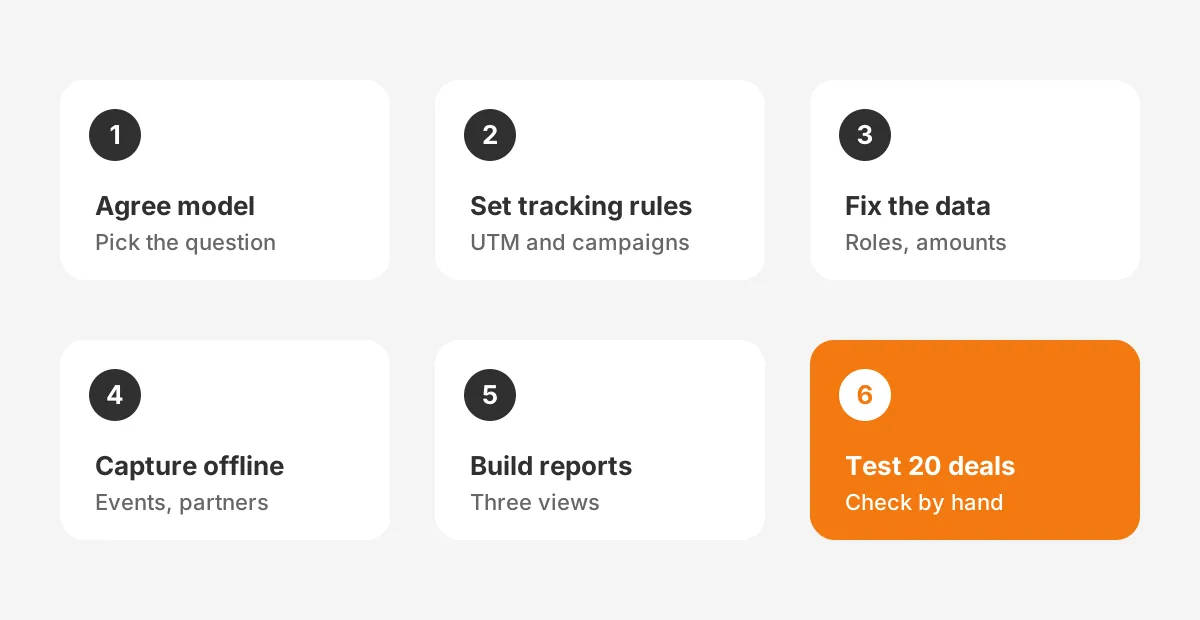
Step 6 is the easiest to skip and the most revealing. If the report misses touches that the sales rep remembers, the data chain has a broken link. Fix the cause, then rerun the test on a new sample.
Revenue attribution software can help once the CRM data is clean. Tools such as Bizible, Dreamdata and HockeyStack add web session data and data-driven models. They still depend on the same contact and deal records.
How Do You Read Attribution Reports Without Double Counting?
Read attribution reports by checking which revenue total each view sums to. A fractional model, such as linear, always adds up to total closed revenue. An influence view does not, because every touched deal counts in full for every campaign.
Take a quarter with three closed deals as an example, using assumed figures. Deal A is $120,000, Deal B is $60,000 and Deal C is $20,000. Total closed revenue is $200,000.
A webinar series touched Deals A and B. A paid search campaign touched Deals B and C. An influence report credits the webinar with $180,000 and paid search with $80,000. Those two lines add up to $260,000, which is more than the company won.
A linear report splits each deal instead. If Deal B had one webinar touch and one search touch, each gets $30,000. The totals then reconcile to $200,000, and finance can trust the sum.
Use four views in one dashboard, each with a clear label:
- Sourced revenue by channel, using first-touch credit.
- Fractional revenue by campaign, using the agreed primary model.
- Influenced revenue by campaign, labelled as overlapping totals.
- Open pipeline by channel, as the early signal for next quarter.
Two decision rules keep budget moves safe. First, move budget only when the primary model and the comparison model point the same way. Second, wait for at least one full sales cycle of data before cutting a channel.
Small samples also distort results. One large deal can make a minor campaign look like the best performer. Show deal counts beside revenue so readers can spot a single outlier.
What Are Common Revenue Attribution Mistakes?
The most common revenue attribution mistake is choosing a model before checking the data. A sophisticated model on broken data produces confident, wrong numbers. Five others are worth checking for.
- Reporting influenced revenue as if it were sourced revenue, which double counts deals.
- Leaving the lead source field open as free text, which creates dozens of spellings.
- Ignoring sales touches such as calls and meetings, which hands all credit to marketing.
- Changing the model every quarter, which makes trends impossible to compare.
- Judging new campaigns before their deals have had time to close.
A sixth mistake is treating attribution as a marketing-only report. Sales leaders should see the same campaign performance view. When sales trusts the numbers, reps add contact roles and log activities, which improves the data for everyone.
Attribution also differs from revenue intelligence. Attribution looks backward at what influenced closed deals. The revenue intelligence article explains the forward-looking side: deal risk, forecasting and conversation data.
Frequently Asked Questions
How does revenue attribution work?
Revenue attribution works by linking touchpoints to contacts, contacts to deals, and deals to closed-won amounts. An attribution model then splits each deal amount across its touchpoints. The CRM sums those shares by campaign, channel or asset, so teams see revenue per marketing activity.
Why is revenue attribution important?
Revenue attribution is important because it shows which marketing channels produce money, not only leads. It helps teams move budget toward campaigns that close deals. It also gives marketing and sales one agreed view of the customer journey. That reduces disputes over lead quality.
How do first touch vs last touch models differ?
First-touch attribution gives all credit to the interaction that first brought a buyer in. Last-touch attribution gives all credit to the final interaction before conversion. First-touch shows which channels create demand, while last-touch shows which channels convert buyers who are already close to deciding.
What is an attribution window?
An attribution window is the period before a conversion in which touchpoints can earn credit. A 90-day window ignores interactions older than 90 days. B2B teams should set the window close to their average sales cycle, or long early touches will lose credit unfairly.
Can Google Analytics handle B2B attribution?
Google Analytics attribution measures website sessions and conversions. It does not see CRM deal amounts or sales activities by default. B2B attribution needs those records. Most teams use Google Analytics for channel data and the CRM for revenue, joined by UTM values.
Where Should Your Revenue Attribution Project Start?
A revenue attribution project should start with one budget question and a manual test of 20 closed deals. That test shows how much of the data chain already works. It also tells the team whether the next step is data repair or report building.
Unboxx sets up revenue attribution in HubSpot and Salesforce, from UTM rules to closed-deal testing. One client story covers fixing conflicting revenue numbers with a HubSpot RevOps migration. To review your attribution data, schedule a consultation.
Let's create something out of this world together.
Have a project in mind? Contact us for expert design and development solutions. Let's discuss how we can help grow your business.
Ready to Unboxx Your Potential?
Build smarter systems. Automate faster. Scale confidently.