
Most agency owners open the CRM on Monday and still cannot name last month's top new business producer. The data sits in the agency management system, carrier portals and producer spreadsheets. MarshBerry puts real organic growth for the average agency at 2.7% (MarshBerry, 2025), so every lost renewal shows.
An insurance sales crm should give owners five report groups: production, retention, pipeline, producer performance and commission. Each one answers a money question in under a minute. This guide lists the reports, the fields behind them and the cadence that keeps them honest.
Key Takeaways
- An insurance sales crm should report production, retention, pipeline, producer results and commissions on one owner dashboard.
- Retention and new business per producer tell an owner more about growth than total written premium.
- Reports are only as good as the AMS sync behind them, so fix data ownership before building dashboards.
What Reporting Should an Insurance Sales CRM Provide?
An insurance sales crm should provide reports that show where revenue comes from, where it leaks and who drives it. Ask what reporting should an insurance sales crm provide to agency owners, and the answer is five report families.
Owners of independent agencies ask the same five questions each month. How much new business did we write? How much of the book did we keep? What is in the pipeline for next quarter? Which producers are on target? Are commissions arriving as expected?
Each question maps to one report family in the CRM:
- Production report: new policies and written premium by producer, line of business and carrier.
- Retention report: policies renewed, lost and rewritten, with the reason for each loss.
- Pipeline report: open opportunities by stage, expected premium and expected close date.
- Producer scorecard: activity, quotes, close ratio and new business against quota.
- Commission report: actual vs expected commissions by carrier and month.
Most CRM reports for insurance agencies fall into these five families. Vendor blogs list 9 to 12 report types, but most are views of the same data. Better Agency, for example, lists contact, campaign, profitability, win and loss, lead source and forecast reports (Better Agency).
Before a report goes on the owner view, name the decision it changes. If nobody can, it belongs on a producer's screen instead. A good insurance sales crm keeps the owner view to one page with eight to ten tiles.
Which Production Reports Do Owners Need Each Week?
Owners need a weekly production report that shows new policies, written premium and new revenue by producer and line. It should compare this week with the same week last year, since insurance sales follow renewal seasons.
The production report is where an insurance sales crm earns its cost. An agency management system records the bound policy. The CRM adds the opportunity, the lead source and the producer who worked it. Together they show which effort turned into premium.
Group the report by these fields:
- Producer and account manager on the record.
- Line of business: personal lines, commercial lines, and life and health.
- Carrier, so owners see where placements concentrate.
- New business versus rewritten business, kept apart.
Two derived numbers belong here. Average premium per policy shows whether producers chase small accounts. Policies per client shows how often producers add a second policy to an account. AgencyBloc lists policies per client as one of six KPIs a life and health agency should track (AgencyBloc, 2022).
A weekly production report also needs a written premium target line. Without the target, a chart of premium is a picture, not a decision. Set the target per producer from the annual plan and divide it by week.
Every production view in the insurance sales crm should count a policy once it is bound in the AMS. A sent quote does not count. Settling that early ends most arguments between sales and service about whose numbers are right.
How Should an Insurance Sales CRM Track Retention?
An insurance sales crm should track retention monthly, by policy and by premium. Every lapsed policy needs a loss reason. Policy count alone hides the loss of one large commercial account.
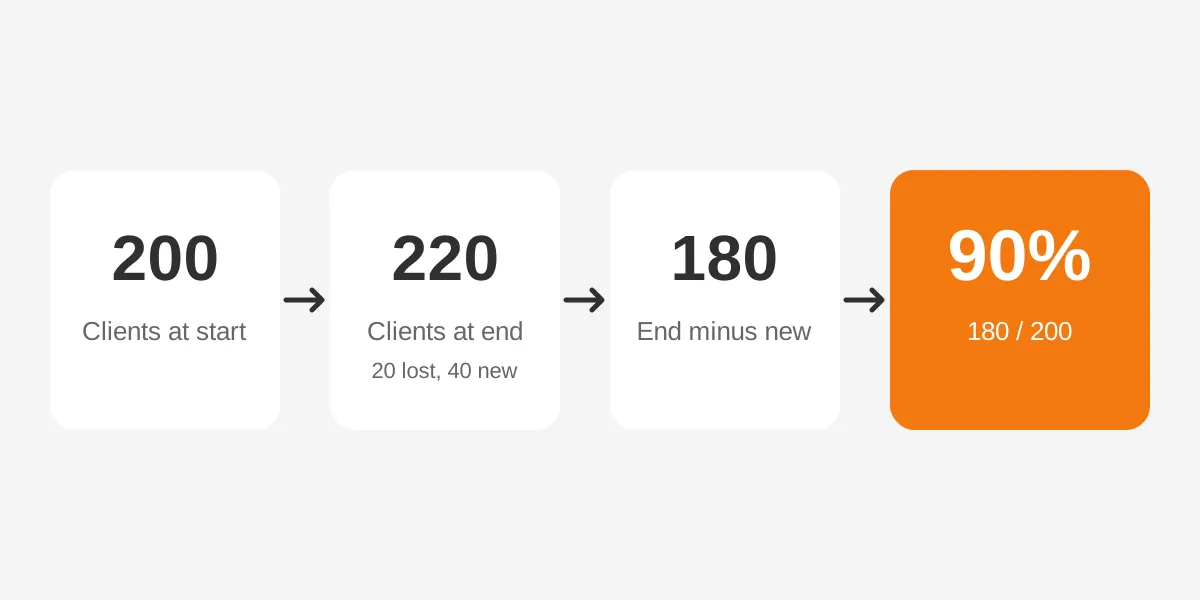
Owners usually ask first how to calculate retention rate. The standard formula takes customers at the end of the period and subtracts new customers gained. It then divides by customers at the start. AgencyBloc shows it with an example: 200 customers, 20 lost and 40 gained gives 90%.
The retention report should split three numbers that agencies often blend:
- Policy retention: the share of policies that renewed.
- Premium retention: renewed premium divided by premium up for renewal.
- Client retention: households or businesses that kept at least one policy.
Add a required loss reason picklist in the CRM: price, carrier non-renewal, service issue, moved, or sold business. A report on loss reasons tells an owner whether to fix pricing, carriers or service.
The renewal report is the forward view of retention. It lists every policy with a renewal date in the next 90 days, its premium and the account manager. Owners should see the top 20 renewals by premium in one table each week.
Cross-sell opportunities sit in the same data. A client with auto but no home policy is a renewal conversation waiting to happen. An insurance sales crm can flag single-line clients and count them by producer. That turns policies per client into a task list.
Which Pipeline and Lead Source Reports Matter Most?
The pipeline report and the lead source report matter most because they predict next quarter's premium. Production reports describe the past. Pipeline reports show what is coming and whether it is enough to hit target.
A pipeline report in an insurance sales crm lists open opportunities by stage. Common stages are new lead, contacted, quoting, proposal sent, bound and lost. Each opportunity carries expected premium, line of business and an expected close date.
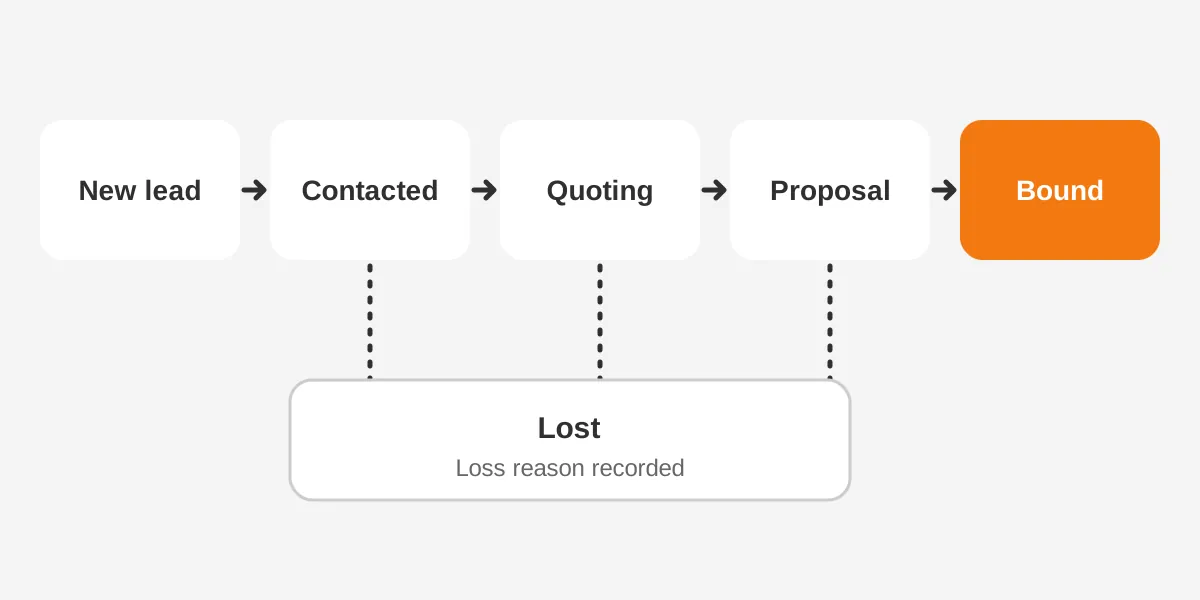
Two ratios come out of the pipeline. The quote to bind ratio shows how often a quote turns into a policy. The close ratio by lead source shows which channels bring buyers rather than shoppers.
The lead source report should list, for each source, the number of leads, quotes, bound policies and premium. AgencyBloc recommends tracking contacts, policies and commissions per lead source, plus close ratio per source and per agent. That view tells an owner where to spend the next marketing dollar.
Set the lead source when the record is created, then lock the field. When producers edit it later, the report drifts toward whichever channel they prefer.
Sales velocity belongs here too. MarshBerry defines it as current year new business as a percentage of prior year commissions and fees. An owner can read it as the speed at which new sales replace the natural loss of the book.
A weighted forecast adds one more view. Multiply each opportunity's expected premium by a stage probability, such as 20% at quoting and 60% at proposal. Set those probabilities from the agency's own close history, not from vendor defaults. Review them each quarter as the history grows.
Keep the pipeline clean with one rule. Any opportunity past its expected close date by 30 days moves to lost or gets a new date. A pipeline full of stale quotes makes every forecast in the insurance sales crm too high.
How Do Producer Scorecards Work in a CRM?
A producer scorecard in a CRM shows each producer's activity, conversion and results against quota on one row. It replaces the monthly meeting where producers bring their own numbers in spreadsheets.
The scorecard reads from left to right, from effort to outcome:
| Measure | What it shows | Source in the CRM |
|---|---|---|
| Calls and meetings | Effort put into new business | Activity records |
| Quotes issued | Opportunities that reached pricing | Opportunity stage history |
| Close ratio | Bound policies divided by quotes | Opportunity outcomes |
| New business premium | Revenue added this period | Bound policies synced from the AMS |
| Retention of own book | Renewals kept by that producer | Renewal records |
| Quota attainment | New business against target | Producer goal records |
New business per producer is the headline number. MarshBerry tracks New Business Dollars per Production Person as a core growth measure. At one agency it cites, producers writing $250,000 of new business revenue a year grew from two to over fifteen.
An activity report alone misleads. A producer with 200 calls and no quotes needs coaching on targeting, not effort. A producer with 20 quotes and two binds needs help with pricing or carrier fit. The scorecard shows which problem it is.
Loss ratio by producer is worth adding for commercial lines. A producer who writes premium with poor loss experience can cost the agency contingent commissions. The CRM needs carrier loss data for this, so treat it as a second phase.
Share the scorecard with producers, not only the owner. Each producer should see the same insurance sales crm numbers the owner sees. The review meeting then moves from defending numbers to planning.
What Commission Reports Should Agency Owners Review?
Agency owners should review an actual vs expected commissions report every month, by carrier and by producer. It catches missing carrier payments before they become write-offs.
The CRM or AMS calculates expected commission from the premium and the commission rate on each policy. The accounting team records what each carrier paid. The report lists the gap for each carrier and flags any gap above a set threshold, such as 5%.
AgencyBloc puts actual vs expected commissions first on its list of six KPIs for life and health agencies. For those agencies, commission statements arrive monthly from dozens of carriers. A missed statement can go unnoticed for a quarter without this report.
The commission report should also show:
- New versus renewal commission, since producers are often paid different splits on each.
- Producer commission owed, so payroll uses the same numbers as sales.
- Commission by carrier, to show dependence on one market.
Most agencies keep commission accounting in the AMS. The insurance sales crm only needs the totals and the gaps. Pull them into the owner dashboard through the AMS integration, so owners do not log into two systems.
Each month, compare commission revenue in the report with the general ledger. A gap larger than rounding means the sync or the AMS commission rates need fixing. Fix that before anyone trusts the dashboard.
How Does the CRM Get Data From the AMS?
The CRM gets policy, premium and commission data from the agency management system. It arrives through an integration, a scheduled export or a carrier download feed. The method decides how fresh every owner report is.
Agency management systems such as Applied Epic, AMS360, HawkSoft and EZLynx hold the policy record. The CRM holds leads, opportunities, activities and producer goals. Owner reporting needs both, joined on the client and policy number.
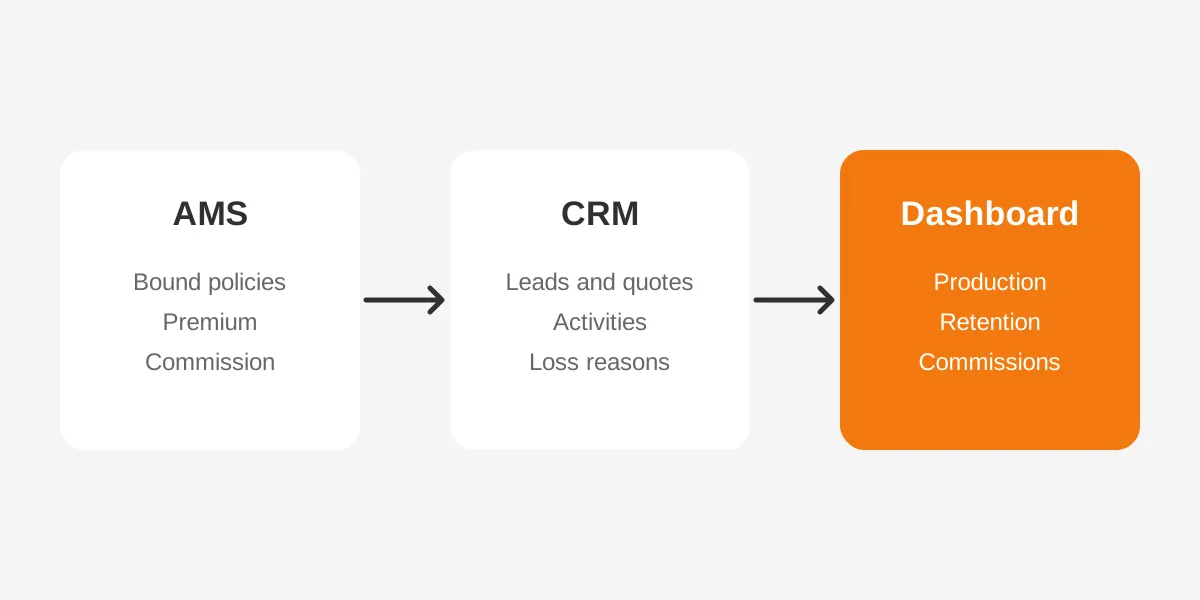
Agree on data ownership before building any dashboard. The AMS is the source of truth for bound policies, premium and commission. The CRM is the source of truth for leads, quotes, activities and lost reasons. Neither system should overwrite the other's fields.
Three sync choices exist, in order of freshness:
- API integration: near real time, best for daily production views.
- Scheduled export: nightly or weekly files, fine for monthly owner reports.
- Manual import: acceptable for a pilot, never for a live dashboard.
Moving records out of an old system first? See how to migrate insurance client data into a CRM. Clean data at migration saves months of report fixes later.
Unboxx designs this split during CRM projects for insurance agencies. The owner dashboard then reads one agreed set of fields from day one.
Which Dashboards Fit Salesforce, HubSpot and Dynamics 365?
Salesforce, HubSpot and Microsoft Dynamics 365 can all run an owner dashboard for an insurance sales crm. They differ in how reports are built, how fresh the data is and what each plan includes.
| Platform | How owner reports are built | Points to check |
|---|---|---|
| Salesforce | Report builder and Lightning dashboards; Financial Services Cloud adds insurance objects | Admin time to set up report types and policy objects |
| HubSpot | Custom report builder on Sales Hub Professional or Enterprise | Reports refresh every two hours; non-table reports cap at 1,000 rows |
| Microsoft Dynamics 365 | Built-in dashboards plus Power BI for multi-source reports | Power BI licensing and data model work |
HubSpot's documentation says custom reports refresh every two hours. New data takes 10 to 15 minutes to appear (HubSpot Knowledge Base, 2026). That is enough for owner reporting, which runs weekly.
Salesforce teaches its report and dashboard builder in a Trailhead module of about 1 hour 50 minutes (Salesforce Trailhead). An agency admin can build the first owner dashboard after that course.
For platform features beyond reporting, the guide on CRM for insurance agents compares Salesforce, HubSpot, Odoo and Dynamics 365. Agencies weighing a custom build can read how to build a custom CRM for insurance agents.
Lay out the owner dashboard in the order of the five questions. Production and pipeline go across the top row, retention and renewals sit in the middle, and commissions go last.
Each tile should link to the detailed report behind it. In an insurance sales crm, that click-through takes an owner from a number to its records.
Whichever insurance crm software the agency runs, restrict who sees what.
The NAIC Insurance Data Security Model Law asks licensees for access controls and multi-factor authentication. Agencies with fewer than ten employees are exempt from its security program section. States adopt the model law one by one, so check the version in your state.
How Often Should Owners Review CRM Reports?
Owners should review pipeline and production weekly, retention and commissions monthly, and producer scorecards and lead sources quarterly. A fixed cadence stops reports from becoming a pile nobody opens.
| Cadence | Reports | Decision it supports |
|---|---|---|
| Weekly | Production, pipeline, top renewals | Where producers and account managers spend the week |
| Monthly | Retention, loss reasons, actual vs expected commissions | Service fixes and carrier follow-up |
| Quarterly | Producer scorecards, lead source, sales velocity | Quotas, hiring and marketing budget |
| Yearly | Book by line and carrier, organic growth | Carrier strategy and the next annual plan |
Set the cadence as calendar events with an owner and a report link. A report subscription that emails the dashboard on Monday morning works in Salesforce, HubSpot and Dynamics 365.
Use the first 90 days to test the numbers. In week one, compare the CRM's written premium with the AMS total. In month one, compare commissions with the ledger. Fix any gap before the first quarterly scorecard review.
The same cadence supports customer journey reporting later. Agencies automating renewal and onboarding journeys can compare a journey orchestration platform versus a CRM.
An insurance agency reporting cadence only works if producers trust the data. Show them the scorecard first, ask what is wrong, and fix it. Trust in the insurance sales crm grows from that first correction.
Which Reporting Mistakes Should Agency Owners Avoid?
The most common mistake is building dashboards before agreeing what each number means. Two reports that define new business differently will never match, and producers will stop trusting both.
Five mistakes show up again and again in agency CRM projects:
- Counting quotes as sales. Production should count bound policies only, taken from the AMS.
- Reporting premium without retention. A growing book of business can still lose its best accounts.
- Letting each producer keep a private spreadsheet. The insurance sales crm must be the only place sales numbers live.
- Leaving loss reasons optional. A blank field makes the retention report useless for decisions.
- Building 40 reports at once. Owners read eight to ten tiles; the rest goes unopened.
A sixth mistake is technical. Agencies often sync the AMS into the CRM once at launch and never again. The insurance sales crm then shows a book of business that drifts further from reality every week.
The fix for each mistake is a rule written down before launch. Write the definition of new business, retention and lost policy on one page. Store it in the CRM as a help text on each report, so new staff read the same rules.
Review the rules once a year with producers and account managers. Lines of business, carriers and commission splits change, and the insurance sales crm reports must change with them.
Avoid judging producers on a single month. Commercial lines renew in uneven waves. A quarterly view in the insurance sales crm gives a fairer picture.
Frequently Asked Questions
What KPIs should an insurance agency owner track?
An owner should track new business premium, retention, close ratio and policies per client. Actual vs expected commissions belongs on the list too. Add sales velocity and new business per producer for growth planning. These cover revenue gained, revenue kept and the producers behind each number.
Can an AMS replace an insurance sales CRM?
An AMS cannot fully replace a CRM for sales reporting. It records bound policies, premium and commissions well. It rarely tracks leads, quotes, lost reasons and producer activity. Most agencies run both and join them through an integration for owner reporting.
What decides how long an owner dashboard takes?
Build time depends mostly on the data, not the charts. With policy data already syncing from the AMS, most of the work is agreeing definitions. One example is when a policy counts as new business. Without a working sync, fix the integration first.
Who should see the producer scorecard?
The owner, the sales manager and each producer should see the scorecard. Producers see their own row and the team average. Account managers see retention and renewals for their book. Role-based access in the CRM keeps commission details limited to people who need them.
What is a good agency retention rate?
No single public benchmark fits every agency, because personal, commercial and benefits books renew differently. Track your own rate monthly by line of business and premium. Then set a target that beats last year and review the loss reasons behind every lapsed policy.
Is Your Insurance Sales CRM Ready for Owners?
An insurance sales crm pays for itself when owners answer five questions in five minutes. They cover production, retention, pipeline, producers and commissions. Start with the AMS sync, agree the definitions, then build one owner dashboard and a fixed review cadence.
Unboxx sets up this reporting on Salesforce, HubSpot and Dynamics 365 through its CRM consulting and implementation services. To review your current dashboards with a consultant, schedule a consultation.
Let's create something out of this world together.
Have a project in mind? Contact us for expert design and development solutions. Let's discuss how we can help grow your business.
Ready to Unboxx Your Potential?
Build smarter systems. Automate faster. Scale confidently.