
A marketing team closes the quarter with 4,000 leads, a record click-through rate and a busy calendar of webinars. The sales team calls it a weak quarter. Finance asks which programs produced revenue, and nobody can answer from one report.
Marketing performance tracking closes that gap. It is the ongoing process of measuring campaigns and channels against business results. Those results include pipeline, revenue and customer acquisition cost. The Gartner 2025 CMO Spend Survey found marketing budgets flat at 7.7% of company revenue. Flat budgets put every dollar under review.
Key Takeaways
- Marketing performance tracking links campaign activity to pipeline and revenue, not only to clicks and leads.
- Reliable tracking depends on UTM parameters, GA4 key events and CRM records that connect to one another.
- A short monthly scorecard with agreed formulas beats a large dashboard nobody trusts.
What Is Marketing Performance Tracking?
Marketing performance tracking is the practice of collecting campaign data from every channel and comparing it with agreed targets. The targets cover reach, leads, pipeline and revenue. The output is a regular marketing performance report that tells a team what to keep, change or stop.
Three ideas sit inside the term. Marketing measurement is the act of capturing numbers, such as sessions, form fills and deal amounts. Marketing analytics is the work of explaining those numbers. Marketing performance management is the decision loop that moves budget based on the results.
Marketing performance tracking connects all three. It turns raw marketing metrics into a short list of marketing KPIs. Each KPI has a target, an owner and a review date. A KPI is a metric the business has decided to act on.
A team that tracks clicks knows what happened on a website. A team that tracks pipeline knows which campaigns create sales conversations. Campaign performance tracking at the deal level is what a CFO asks to see.
A working setup has four parts:
- Tagged traffic, so each visit carries its source, medium and campaign.
- Defined conversions, such as demo requests recorded as key events.
- A CRM that stores contacts, opportunities and closed-won revenue.
- A marketing performance dashboard that joins the three on a fixed schedule.
How Does Tracking Differ From Monitoring and Analysis?
Marketing performance monitoring is the day-to-day watch on live campaigns. It catches a broken form, a paused ad or a sudden drop in conversion rate. Monitoring asks whether something is wrong right now.
Marketing performance analysis looks backward over a full period. It compares segments, channels and offers to explain results. Marketing performance measurement is the layer underneath both, the data capture itself.
Marketing performance tracking holds the three together with fixed targets and a fixed review rhythm. Monitoring feeds it alerts, and analysis feeds it explanations. Without tracking, monitoring and analysis produce interesting facts but no budget decisions.
Why Does Marketing Performance Tracking Matter for B2B?
Marketing performance tracking matters because B2B budgets are fixed and the buying cycle is long. A deal can take six months and involve a committee of buyers. Without tracking, budget follows opinions and last-click reports.
The Gartner survey of 402 CMOs adds pressure. In 2025, 59% of CMOs said they lacked the budget to run their strategy. Paid media took 30.6% of marketing budgets. When paid media takes that share, proof of return decides which programs survive the next planning cycle.
Good tracking answers four questions every quarter:
- Which channels produce opportunities, not only leads?
- What does each new customer cost to acquire?
- How long does a lead take to become revenue?
- Where should the next budget dollar go?
Marketing performance tracking also protects programs that work slowly. A webinar series may produce few leads but a high share of closed deals. Without deal-level data, that series looks weak and loses budget to cheaper lead sources.
Shared numbers end the monthly argument between marketing and sales. Both teams read the same marketing reporting, built on the same definitions. A marketing qualified lead means the same thing in both meetings, and the debate moves to what to change.
The AI growth marketing services page describes how Unboxx connects campaign strategy, marketing automation and revenue reporting for B2B teams. Tracking is the part that proves whether the other two work.
Which Marketing Performance Metrics Belong at Each Stage?
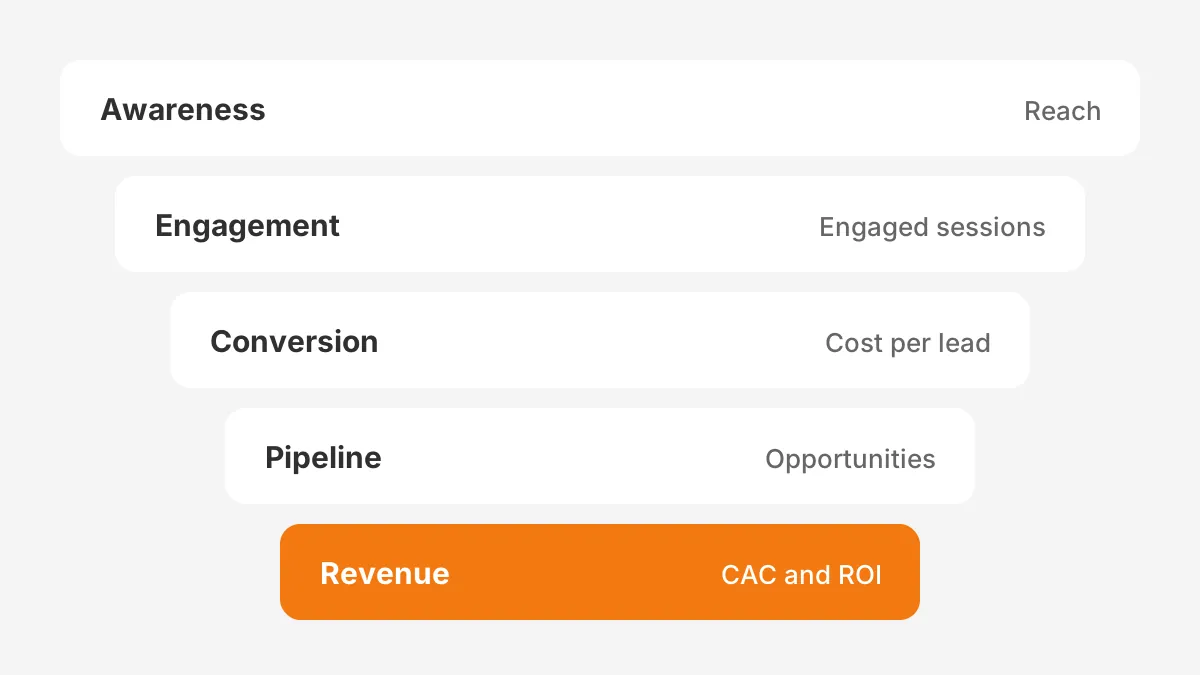
The right marketing performance metrics depend on the funnel stage each campaign serves. A brand campaign and a demo-request campaign should not be judged on the same number. Grouping metrics by stage answers a common question: what metrics should marketing track?
| Funnel stage | Example metrics | Where the data lives |
|---|---|---|
| Awareness | Reach, impressions, new users, branded search volume | Ad platforms, GA4, search console |
| Engagement | Engaged sessions, content downloads, webinar attendance | GA4, marketing automation platform |
| Conversion | Form fills, cost per lead, conversion rate, MQLs | GA4 key events, CRM |
| Pipeline | SQLs, opportunities, lead to opportunity conversion rate, pipeline velocity | CRM |
| Revenue | Closed-won revenue, customer acquisition cost, marketing ROI, customer lifetime value | CRM, finance system |
The top two rows are useful early signals, but they can become vanity metrics. A rise in impressions with no change in opportunities means the audience is wrong or the offer is weak.
For B2B marketing metrics, the lower rows carry the most weight. Three formulas cover most reviews:
- Customer acquisition cost formula: total sales and marketing spend divided by new customers won.
- Marketing ROI: revenue credited to marketing, minus marketing cost, divided by marketing cost.
- Return on ad spend: revenue credited to an ad channel divided by spend on that channel.
These answer how to calculate marketing ROI in a way finance accepts. ROAS can look healthy while ROI is negative. ROAS ignores salaries, tools and agency fees. The marketing automation ROI guide shows the same formula applied to software spend.
Two pipeline measures need clear definitions. Marketing sourced pipeline counts opportunities whose first touch came from marketing. Marketing influenced pipeline counts opportunities that had any marketing touch before the deal closed.
Where Does Marketing Performance Data Come From?
Marketing performance data comes from three kinds of system: traffic analytics, ad platforms and the CRM. Each one sees part of the buyer journey. Reliable marketing performance tracking joins them through shared identifiers.
Google Analytics 4 records website behaviour. Google describes GA4 as event-based rather than session-based.
Google defines a key event in GA4 as an event that measures an action particularly important to the business. Any event can be marked as one. A demo request or a deep scroll on a pricing page are typical choices.
Key events in GA4 show what visitors did, but not who they were. That is why the CRM matters. HubSpot, Salesforce and Microsoft Dynamics 365 store contacts, companies, opportunities and closed-won amounts. They know which visitor became a customer.
Ad platforms such as Google Ads and LinkedIn Ads hold spend, impressions and clicks. Each platform also reports its own conversions, a problem covered under common mistakes below.
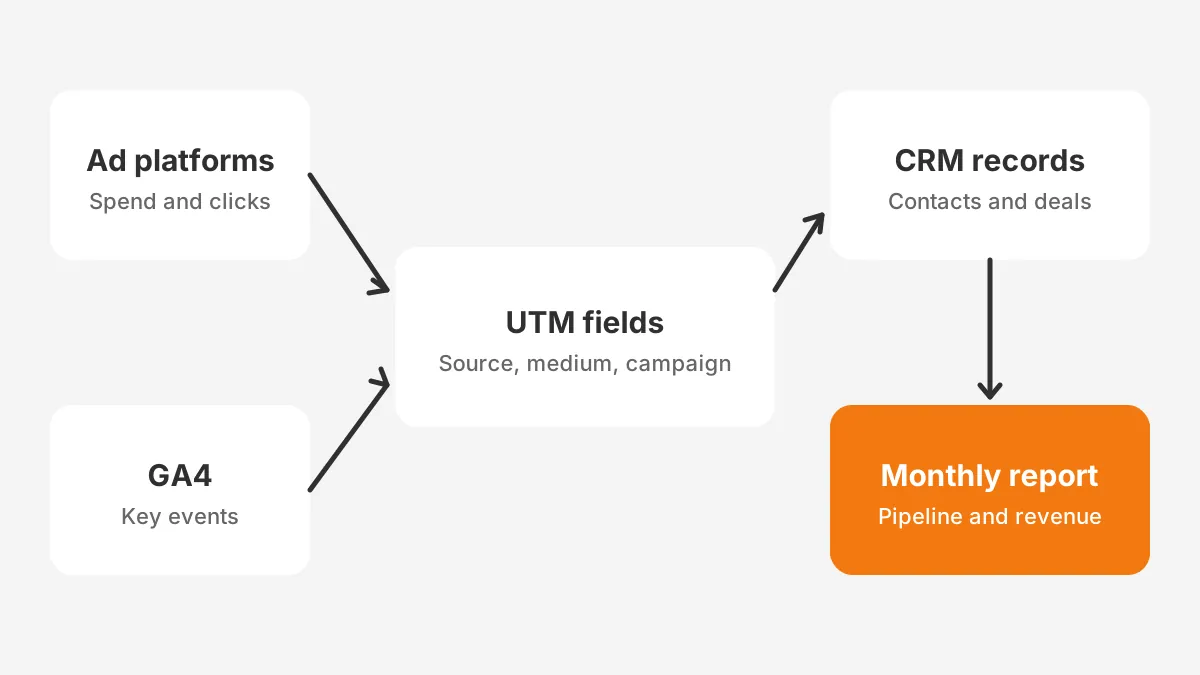
UTM parameters are the thread that ties the systems together. Google's guide to custom campaign URLs says to always use utm_source, utm_medium and utm_campaign. Missing values show as "(not set)" in reports. Values are also case sensitive, so "LinkedIn" and "linkedin" become two sources.
UTM tracking only helps when the CRM keeps the values. A hidden form field copies each UTM value into the contact record. From there, the value follows the contact onto the opportunity.
First-party data closes the last gap. Offline conversions, such as a trade show conversation or a referral, happen outside the website. Sales reps should log them in the CRM as campaign members or activities, so closed loop reporting can see them.
How Do Attribution Models Change the Numbers?
Attribution models change the numbers because each one splits credit for the same deal in a different way. Marketing attribution is a rule, not a fact. The same quarter can make webinars look strong under one model and weak under another.
HubSpot attribution reports offer five models: First Touch, Last Touch, Linear, Time Decay and Empirical. The Empirical model replaced the older U-shaped, W-shaped and J-shaped models. HubSpot's Deal Revenue Attribution report requires Marketing Hub Enterprise, as does Deal Create Attribution.
The Contact Create Attribution report credits the touches that led to a new contact. It suits top-of-funnel reviews. Deal-level reports suit marketing performance tracking for pipeline, because they follow the record a sales qualified lead becomes.
| Model | How credit is split | Best use |
|---|---|---|
| First touch | All credit to the first interaction | Judging which channels start new conversations |
| Last touch | All credit to the final interaction before conversion | Judging which channels close a conversion |
| Linear | Equal credit to every interaction | A neutral view of long B2B journeys |
| Time decay | More credit to recent interactions | Short campaigns with a clear deadline |
| Data-driven or Empirical | Credit based on observed conversion paths | Mature setups with high data volume |
GA4 offers fewer choices. Google's attribution documentation lists three models: data-driven attribution, paid and organic last click, and Google paid channels last click. First click, linear, time decay and position-based models stopped working in GA4 in November 2023.
The practical rule is to pick one model for budget decisions and keep it all year. First touch attribution and last touch attribution are easy to explain to a sales team. Multi-touch attribution is fairer, but it needs clean data on every interaction.
The revenue attribution guide covers how CRM records connect to deal amounts. For companies with large brand budgets, marketing mix modeling and holdout tests add a check that attribution cannot provide. A holdout test pauses a channel in one region and measures the change.
How Do You Set Up Marketing Performance Tracking?
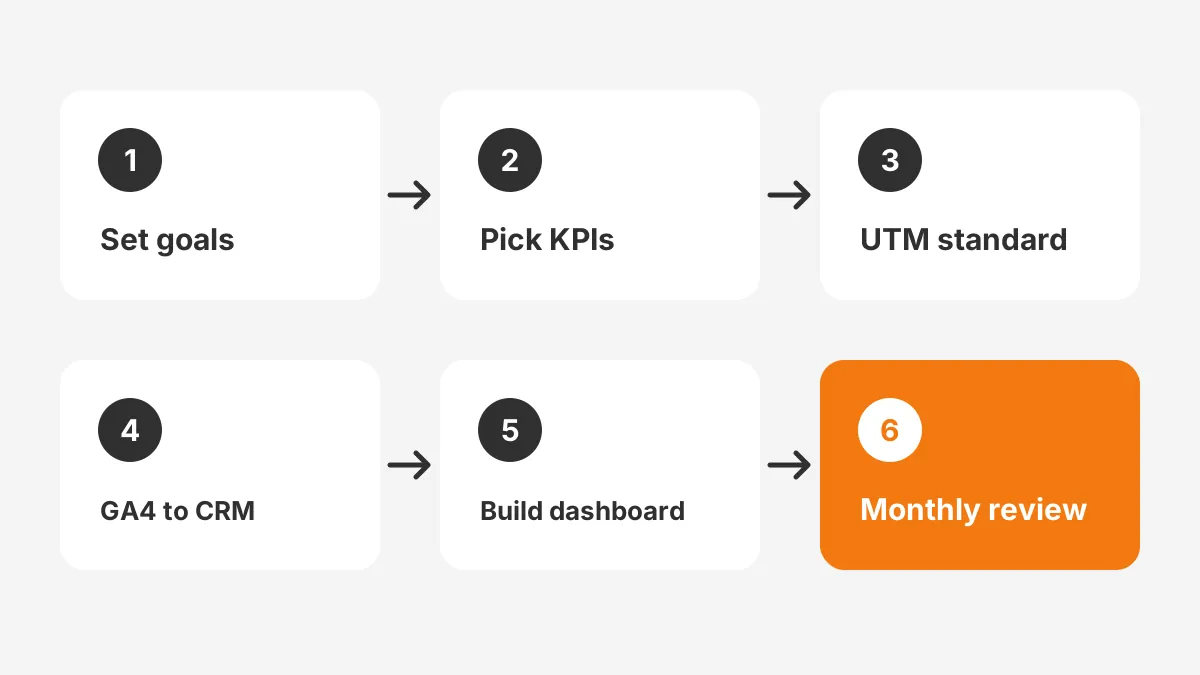
A team sets up marketing performance tracking in six steps, from goals to a recurring review. Each step depends on the one before it. A dashboard built before the naming standard and the GA4 to CRM connection has nothing reliable to show.
- Set business goals first. Agree on the revenue, pipeline and customer targets for the year with sales and finance.
- Choose the marketing KPIs. Pick five to eight metrics that link to those goals, with one owner each.
- Write a UTM naming standard. Fix the allowed values for source, medium and campaign, all in lowercase.
- Connect GA4 and the CRM. Mark key events in GA4 and pass UTM values into contact and deal records.
- Build the dashboard. Create one marketing dashboard per audience, with targets beside every number.
- Review and act. Hold a monthly review that ends with budget moves, not only observations.
Step three looks minor, yet inconsistent naming splits one channel into two or three report rows. A naming standard might allow only "linkedin", "google" and "email" as sources. Every campaign link is then built from a shared template, not typed by hand.
Step four is where CRM reporting starts. In HubSpot, original source fields fill in automatically for each contact. In Salesforce, campaigns and campaign members carry the link between marketing activity and opportunities. Either way, deals need contact roles, or revenue never reaches the campaign.
Step five should stay small. The CRM dashboard guide explains how each chart reads from a saved report. One wrong filter breaks every chart above it. Marketing tracking tools such as Looker Studio or Power BI can join GA4 and CRM data. They help when native reports fall short.
Dedicated marketing performance tracking tools, such as multi-touch attribution platforms, sit on top of the same data. They read GA4, ad platform and CRM records, then apply their own models.
They cannot fix missing UTM values or deals without contact roles. Buy one only after steps one to four hold up for a full quarter.
Teams on Salesforce often add CRM Analytics for blended views. The Salesforce CRM Analytics consulting page covers that option. Smaller teams can start with native HubSpot or Salesforce reports and add a BI tool later.
What Does a Marketing Performance Tracking System Need?
A marketing performance tracking system needs five components that stay in place after launch. Each one has an owner, so the system survives staff changes.
- A written KPI sheet with formulas, targets and data sources.
- A UTM builder template that enforces the naming standard.
- CRM fields for original source, latest source and campaign.
- Lifecycle stages from lead to marketing qualified lead, sales qualified lead and customer.
- A saved dashboard and a recurring calendar slot for the review.
Lifecycle stages matter most. Marketing performance tracking counts conversions between stages, so every stage needs an entry rule. A lead becomes an MQL at an agreed score, and an SQL when sales accepts it.
What Does a Monthly Marketing Scorecard Look Like?
A monthly scorecard is a one-page marketing performance report with targets, actuals and one decision per row. It is the output that makes marketing performance tracking useful to leadership. The figures below are an example with assumed numbers, not benchmarks.
Consider a B2B software company with a monthly marketing spend of $60,000. In the example month, it recorded these results:
- 600 new leads, so cost per lead was $100.
- 120 marketing qualified leads, a 20% lead to MQL rate.
- 30 opportunities worth $450,000 in marketing sourced pipeline.
- 8 new customers worth $160,000 in first-year revenue.
From those figures, customer acquisition cost on marketing spend alone was $7,500. That is $60,000 divided by 8 customers. A full CAC would add sales salaries, so the true figure is higher.
The lead to opportunity conversion rate was 5%, or 30 out of 600 leads. If the target was 6%, the review asks which channel fell short.
In this example, paid social produced 40% of leads but only 10% of opportunities. The decision is to cut paid social spend and move it to webinars.
Marketing ROI on first-year revenue was ($160,000 minus $60,000) divided by $60,000, or about 167%. Customer lifetime value would raise that figure if customers renew. The scorecard records both numbers, so leadership sees short-term and long-term return.
That is how to measure marketing performance so that it leads to action. Each row has a target, an actual, a variance and a named decision. A row with no decision can drop off the scorecard next month.
A 45-minute review agenda keeps the meeting on decisions. Spend ten minutes on variances, twenty on causes and fifteen on budget moves. Marketing performance tracking only pays off when the meeting ends with a change in spend, targeting or offer.
The scorecard should also show a 3-month trend for each row. One weak month can be noise. Three weak months in a row is a pattern that needs a decision.
What Mistakes Break Marketing Performance Tracking?
The mistakes that break marketing performance tracking are almost always data mistakes, not reporting mistakes. A well-designed dashboard cannot repair missing fields. Six data problems come up again and again:
- Untagged links, which push traffic into "direct" or "(not set)".
- Inconsistent UTM values, such as "Email" and "email" in the same quarter.
- Deals without contact roles, so revenue never connects to marketing touches.
- Duplicate contacts, which split one buyer's history across two records.
- Changing the attribution model mid-year, which makes quarters impossible to compare.
- Judging campaigns too soon, before a long sales cycle has run its course.
Measuring too soon is the easiest to miss. A campaign launched in March may not create revenue until September. An early review should use leading indicators such as MQLs and meetings, then revisit revenue later.
Vanity metrics cause a second kind of error. Follower counts and impressions are easy to grow and easy to report. They rarely predict revenue on their own. Keep them on a channel report, not on the leadership scorecard.
Ad platform totals overlap as well. Google Ads and LinkedIn Ads can each claim the same demo request. Marketing performance tracking should count conversions once, in GA4 or the CRM, and use platform figures only for in-platform tuning.
The fix for most of these mistakes is ownership. A revenue operations lead owns the UTM standard, field definitions and the attribution model. One HubSpot RevOps success story shows how one owner and one source of truth ended conflicting revenue numbers.
Frequently Asked Questions
How often should marketing metrics be reviewed?
Marketing metrics should be reviewed weekly for active campaigns and monthly for the full scorecard. Weekly checks catch broken tracking and wasted ad spend early. Monthly reviews move budget. Quarterly reviews judge pipeline and revenue, because B2B deals often take longer than a month to close.
How does marketing analytics differ from performance tracking?
Marketing analytics explains why results happened, using analysis of behaviour, segments and channels. Performance tracking compares results with agreed targets on a fixed schedule. Tracking tells a team that pipeline fell 15% short. Analytics then finds the cause, such as a drop in paid search conversion rate.
Which tools does a B2B team need for tracking?
A B2B team needs three tools at minimum. These are Google Analytics 4 for website behaviour, a CRM such as HubSpot or Salesforce, and ad platform reports. A BI tool such as Looker Studio or Power BI helps when data must be joined across systems. Start with native reports first.
Who should own marketing performance tracking?
A marketing operations or revenue operations lead should own the tracking setup. That person controls the UTM standard, the CRM field definitions and the attribution model. Channel managers own their own metrics. The CMO or head of marketing owns the monthly scorecard and the budget decisions it produces.
Can a small team track performance without expensive tools?
A small team can track marketing performance with free GA4, a free CRM tier and a spreadsheet scorecard. The essentials are a UTM naming standard, key events for real conversions and deal records that keep source fields. Paid attribution tools add value only after those basics work.
How Can Unboxx Help With Marketing Performance Tracking?
Unboxx helps B2B teams set up marketing performance tracking across GA4, HubSpot, Salesforce and Microsoft Dynamics 365. The work covers UTM standards, CRM field mapping, attribution setup and a monthly scorecard leadership can trust.
The result is one report that both marketing and sales accept. To review the current setup and find the gaps, schedule a consultation with Unboxx.
Let's create something out of this world together.
Have a project in mind? Contact us for expert design and development solutions. Let's discuss how we can help grow your business.
Ready to Unboxx Your Potential?
Build smarter systems. Automate faster. Scale confidently.