

Most B2B marketing teams can report opens, clicks and form fills. Far fewer can show what their platform returned in closed revenue. The Ascend2 State of Marketing Automation 2024 survey asked 387 marketing decision-makers about their barriers. Collecting quality data topped the list at 52%.
Marketing automation ROI is the net gain from automated programs divided by their full cost, shown as a percentage. This guide shows how to calculate marketing automation ROI for a B2B team. It covers which costs and returns to count and how to prove the result.
Key Takeaways
- Marketing automation ROI equals net gain divided by total cost, using gross profit rather than raw revenue.
- Attribution model choice can multiply the reported return, so a holdout group is the fairest proof.
- Payback in B2B starts after the sales cycle, so add the cycle length to any payback estimate.
What Is Marketing Automation ROI and Why Measure It?
Put plainly, marketing automation ROI measures what the platform earns back on the money and staff time it consumes. The extra profit and saved cost go on one side. Everything the program costs over the same period goes on the other.
The figure matters because the spend is real and recurring. Platforms such as HubSpot Marketing Hub, Salesforce Marketing Cloud Account Engagement and Dynamics 365 Customer Insights carry yearly costs. Each one brings licence fees, setup work and admin time. Finance teams want a number they can compare with other investments.
In practice, three decisions hang on the marketing automation ROI figure. Leaders use it to renew or cancel a platform and to fund new workflows. They also use it to compare marketing roi across channels. A clear figure turns a tooling debate into a budget decision.
Marketing automation ROI differs from campaign metrics such as open rate or cost per lead. Those show activity and efficiency. ROI shows whether the whole program earns more than it costs. A team can post strong click rates and still report a negative marketing automation ROI.
How Do You Calculate Marketing Automation ROI?
You calculate marketing automation ROI by subtracting total cost from total gain. Then divide by total cost and multiply by 100. The marketing automation roi formula is the standard return on investment formula applied to one program:
ROI (%) = (financial gain from automation minus total automation cost) divided by total automation cost, multiplied by 100
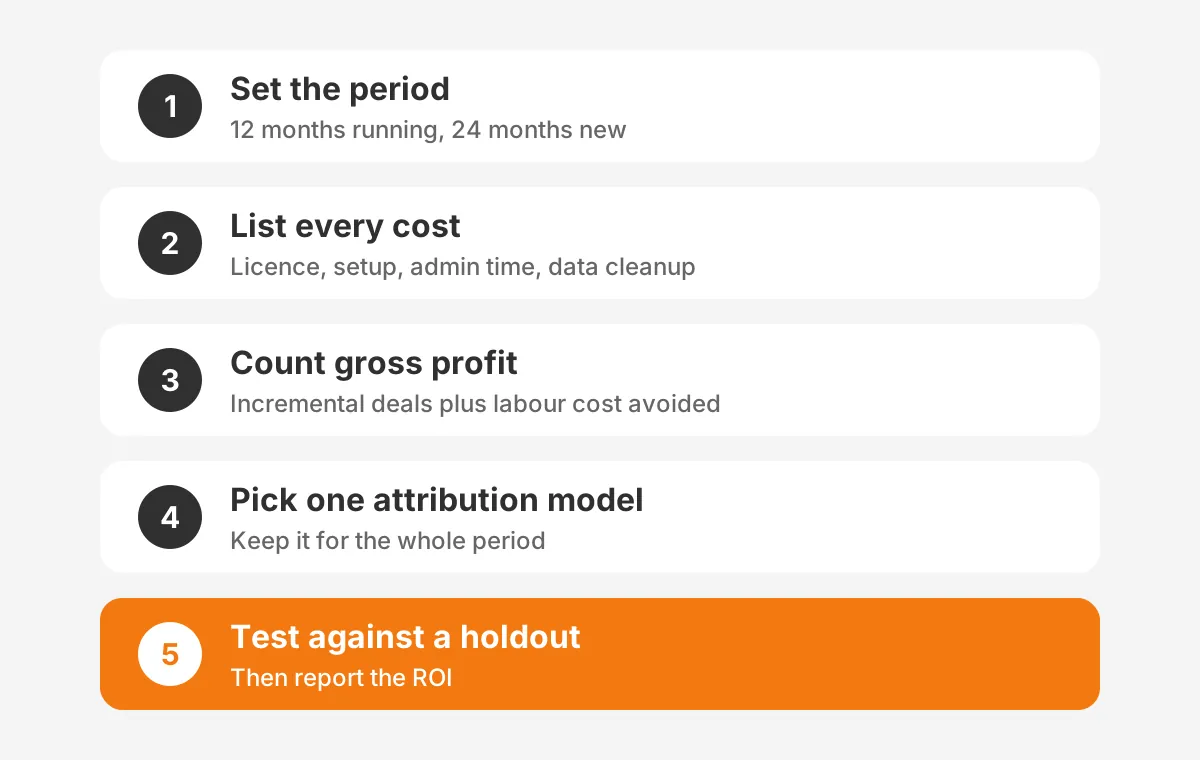
The roi formula is easy. Teams go wrong on the inputs. Follow these five steps for each roi calculation:
- Set the period. Use 12 months for a running program, or the first 24 months for a new platform.
- List every cost line, including staff time, setup fees and data cleanup.
- Count the gain as gross profit from incremental deals, plus labour cost avoided.
- Decide how revenue is credited, using one attribution model for the whole period.
- Run the formula, then test the gain against a holdout group before reporting it.
Step three carries the most weight. Revenue is the wrong numerator for a return on marketing investment. Every deal also consumes product cost and sales effort. Gross profit keeps the result comparable with other investments the finance team reviews.
A marketing automation roi calculator is a spreadsheet version of these five steps. Build it with one row per cost line and one row per gain line. Keep the assumptions in labelled cells, so anyone can see how measuring marketing automation roi produced the final number.
Which Costs Belong in the ROI Calculation?
Every cost that would disappear if the program stopped belongs in the calculation. Licence fees are the visible part of marketing automation costs. Staff time, implementation and data work are often larger and are the lines most teams leave out.
Marketing automation pricing varies by tier and contact volume. On the HubSpot Marketing Hub pricing page (2026), Professional requires a one-time onboarding fee of $3,000. Enterprise starts at $3,600 a month and requires a one-time onboarding fee of $7,000.
| Cost line | What it covers | Often missed? |
|---|---|---|
| Platform licence | Seats, contact tiers and add-ons | No |
| Onboarding and setup | Vendor onboarding fee and partner build work | Sometimes |
| Admin time | Share of salary for the person running workflows | Yes |
| Data cleanup | Deduplication, field mapping and consent records | Yes |
| Content and creative | Emails, landing pages and nurture assets | Yes |
| Integrations | CRM integration, connectors and maintenance | Sometimes |
Count the marketing automation cost for the same period as the gain. A first-year view should include one-off setup costs. A steady-state view should spread those costs over the expected life of the platform, usually three years.
Suppose onboarding, partner setup and data cleanup total $23,000 as one-off costs. Over a three-year life, that adds $7,667 to each year. The first-year ROI will look lower than later years, and both views are honest if labelled.
The marketing automation software itself is rarely the largest line. In a mid-sized B2B team, one admin at a quarter of their time can cost more than the licence. Leaving that line out makes every result look better than it is.
Which Returns Should B2B Teams Count?
B2B teams should count incremental gross profit from closed-won revenue and the labour cost the automation removes. Opens, clicks and marketing qualified lead counts are useful marketing automation metrics, but they are not returns on their own.
Marketing automation benefits fall into four groups, and each needs its own measure:
- Revenue gain: extra closed-won deals from lead nurturing, measured as gross profit.
- Pipeline contribution: the share of sales pipeline value that automated programs sourced or advanced.
- Cost avoidance: time saved on manual sends, list pulls and lead routing, valued at loaded hourly cost.
- Retention gain: renewals or expansion linked to onboarding and customer lifetime value programs.
Pipeline contribution is a leading indicator, not a return. Report it monthly, because closed revenue in B2B lags by the length of the sales cycle. Convert it into gain only when deals close.
How do you value time saved?
Value time saved at the loaded hourly cost of the person who used to do the work. Count only hours that moved to other tasks. If nobody does anything new with the freed hours, the saving is real on paper but absent from the budget.
Automated email is usually the first place a return appears. Welcome series, demo follow-ups and renewal reminders replace manual sends. For email automation roi, compare reply and meeting rates with the manual process it replaced. Then follow those meetings to closed deals.
Track the conversion path from marketing qualified lead to sales qualified lead to closed deal. Customer acquisition cost and cost per lead show efficiency between those stages. Lead scoring makes the hand-off measurable. Our guide to HubSpot lead scoring setup and thresholds explains how to set it.
How Does Attribution Change the Return You Report?
Attribution decides how much of each closed deal you credit to marketing automation. That choice can multiply or shrink the reported return. Marketing attribution splits revenue across the touches a buyer had before signing. Different models give the same touch sharply different credit.
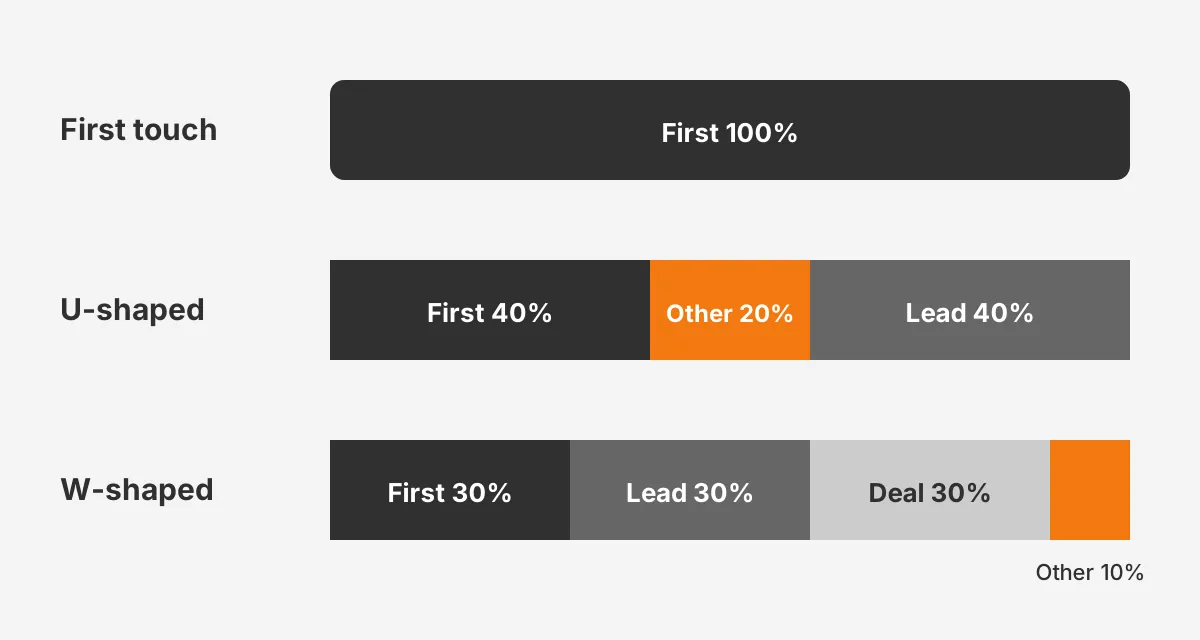
HubSpot documents its attribution model options in its attribution reporting guide (2026). First touch attribution gives 100% of credit to the first interaction. Last touch attribution gives 100% to the last. Linear splits credit equally across every interaction.
Multi-touch attribution models weight key moments. The same HubSpot guide gives these splits:
| Model | How credit is split | Best used for |
|---|---|---|
| First interaction | 100% to the first touch | Judging awareness programs |
| Last interaction | 100% to the last touch | Judging closing campaigns |
| Linear | Equal credit to every touch | Long, steady nurture paths |
| U-shaped | 40% first, 40% lead conversion, 20% spread | Lead generation programs |
| W-shaped | 30% first, 30% lead creation, 30% deal creation, 10% spread | Full-funnel B2B reporting |
| Time decay | More credit to recent touches, 7-day half-life | Short buying cycles |
Pick one model before the period starts and keep it. A mid-year switch lets the program choose its most flattering view. For revenue attribution in B2B, the W-shaped model fits best, because it credits the lead and the deal stage.
A buyer finds a webinar, receives four nurture emails, books a demo and signs. Under first touch, the webinar takes all credit. Under U-shaped, the emails share at most 20%, because the first touch and lead conversion take 80%. Under linear, they hold four of six shares.
Attribution needs clean data to work. Closed-loop reporting depends on CRM integration between the automation platform and the sales system. HubSpot notes that revenue attribution includes only closed-won deals with an amount, create date and close date. Missing fields remove deals from the report.
How Does a Holdout Test Prove the Return?
A holdout test proves the return by keeping a random group of leads out of the automation. Its close rate is then compared with the nurtured group. The difference is the incremental effect. That is the only part of revenue the program caused.
Incrementality testing is now common practice. EMARKETER and TransUnion data from July 2025 covers US brand and agency marketers. It found that 52.0% use incrementality testing to measure campaigns.
A control group design for a B2B nurture program follows four rules:
- Assign 10% of eligible leads at random to the holdout before any automated touch.
- Let sales work both groups the same way, with no flag on holdout records.
- Run the test for at least one full sales cycle, plus 30 days.
- Compare closed-won rates, not open or click rates, between the two groups.
Small B2B lists make tests noisy. With 2,000 leads a year, a 10% holdout gives only 200 records. Run the test over two cycles, or pool similar programs, before treating a small gap as real.
What if you cannot hold out leads?
Some teams cannot hold back leads because sales objects or volume is too low. Use a before-and-after cohort instead. Compare close rates for leads created in the six months before launch with the six months after. Note any price, product or team changes in the same window.
A matched-segment test is another option. Turn a nurture stream on for one region or industry and leave a similar one untouched. The gap is weaker evidence than a random control group, so report it with that caveat.
What Does a Marketing Automation ROI Example Look Like?
A worked marketing automation roi example shows how costs, holdout results and margin combine into one figure. The numbers below are assumed figures for a fictional mid-sized B2B manufacturer, chosen for illustration. They are not benchmarks.
Assumed first-year costs total $65,500. They cover a $12,000 licence, a $3,000 onboarding fee and $15,000 of partner setup. A quarter of a $90,000 admin salary adds $22,500. Data cleanup adds $5,000, and nurture content adds $8,000.
The team sends 2,000 leads through nurture and holds back 200 at random. The 1,800 nurtured leads close 54 deals, a 3.0% rate. The 200 holdout leads close 4 deals, a 2.0% rate.
- Incremental deals: 1.0 percentage point times 1,800 leads equals 18 deals.
- Incremental gross profit: 18 deals times $24,000 times a 40% gross margin equals $172,800.
- Time saved: 6 hours a week times $55 an hour times 52 weeks equals $17,160.
- Total gain: $189,960.
The marketing automation roi is ($189,960 minus $65,500) divided by $65,500, times 100. That gives 190%. The program returns $2.90 in gross profit and saved time for every dollar spent.
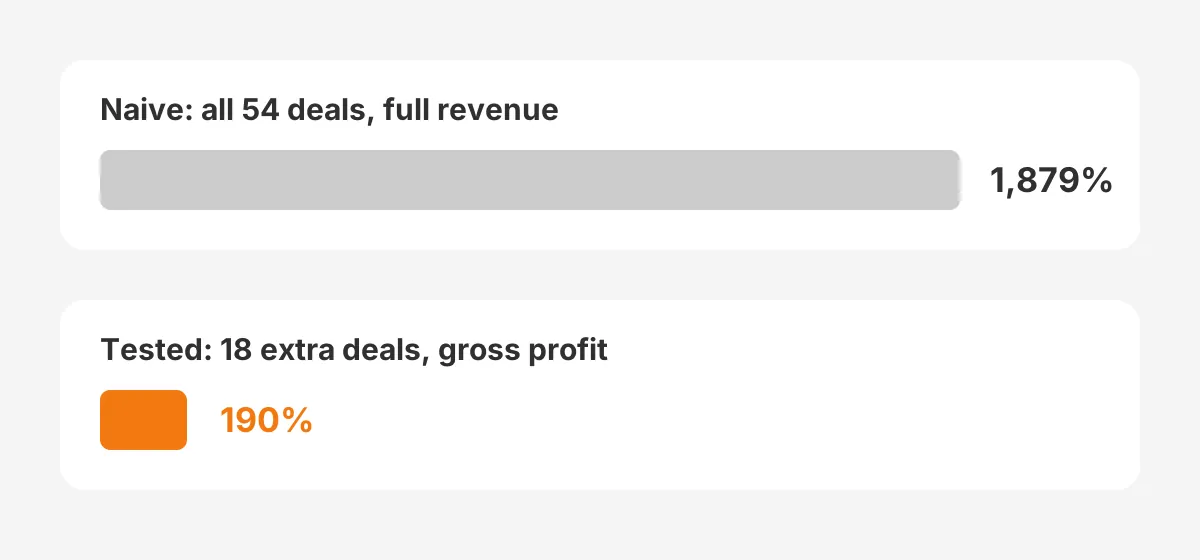
The naive version tells a different story. Crediting all 54 deals at full revenue gives $1,296,000 of gain and an ROI of 1,879%. Both figures use the same data. Only the holdout-tested, margin-based figure survives a finance review.
How Long Does Marketing Automation Take to Pay Off?
Marketing automation usually takes one sales cycle plus four to six months of steady gain to pay off in B2B. Payback period equals total cost divided by monthly net gain, plus the months before the first influenced deals close.
In the worked example, monthly gain at full run rate is $15,830. Dividing $65,500 by $15,830 gives 4.1 months. Add an assumed four-month sales cycle, and payback lands at about eight months after launch.
To estimate your own payback period, follow three steps:
- Divide yearly gain by 12 to get monthly gain at full run rate.
- Divide total first-year cost by that monthly gain.
- Add your median sales cycle in months, taken from closed-won deals.
Published figures are faster but older. A Nucleus Research note (2021) found $5.44 in benefits per dollar over three years, with payback under six months. That note reviewed 16 ROI case studies published between 2016 and 2020.
Use such marketing automation roi statistics as context, not targets. Vendor case studies tend to feature successful projects. Your own payback depends on deal size, cycle length and how much manual work the program replaces.
Why Does Marketing Automation ROI Fall Short?
Marketing automation ROI falls short when data is poor, goals are vague or closed revenue never reaches the report. Most causes sit outside the software. When marketing automation fails, the tool is rarely the reason.
The Ascend2 2024 survey ranked the barriers. Collecting quality data led at 52%, and creating an overall strategy followed at 47%. Only 9% of respondents had fully automated their buying journeys.
Each barrier hits the calculation in a different place. Poor data quality hides closed revenue from the report, which shrinks the gain. A missing strategy spreads effort across low-value workflows, which raises the cost. Either way, the reported marketing automation ROI drops before anyone questions the platform.
Five problems account for most weak results:
- Poor data quality, with duplicate contacts and missing lifecycle stages.
- No CRM integration, so closed revenue never reaches the marketing report.
- Generic nurture streams that send the same content to every segment.
- No lead scoring, so sales ignores the leads marketing passes over.
- Unused features, where the team pays for Enterprise and runs Starter workflows.
Most fixes start with setup rather than new tools. A planned rollout avoids the worst gaps, and our phase-by-phase marketing automation implementation plan covers data, integration and workflow order. Teams choosing between platforms can compare fit in our Pardot vs HubSpot comparison for B2B marketing teams.
How Do You Improve Marketing Automation ROI?
Marketing automation ROI improves when incremental gain per lead rises and cost per program falls. Gains come from better targeting and faster follow-up. Savings come from retiring unused workflows and licence tiers.
Start with the programs closest to revenue. Lead scoring, fast lead routing and sales alerts change close rates more than newsletter design does. Each one shortens the time between buyer intent and a sales conversation.
Next, prune the workflow list. Export every active workflow with its enrolment count and last edit date. Retire any workflow with no enrolments in 90 days. Fewer workflows mean fewer conflicts, less admin time and a cleaner marketing automation ROI calculation.
Then tighten the measurement loop. Connect the platform to the CRM, define lifecycle stages once and audit data quality each quarter. Our guide to calculating, measuring and proving CRM ROI uses the same cost and gain structure. Both reports can share one model.
For B2B marketing automation, segment nurture by buying stage and account size. A marketing automation tools review should also ask which features the team uses. Paying for unused tiers lowers the return without adding any gain.
What should the finance report include?
A finance-ready report fits on one page. List each cost line, each gain line, the attribution model and the holdout result. Show the ROI, the payback month and the assumptions behind them. Finance teams accept a modest, tested figure faster than a large, untested one.
Teams that want outside help can work with the AI Growth Marketing team at Unboxx. The service covers campaign strategy, marketing automation and revenue reporting. A shared revenue report is often the first deliverable, because it gives every later change a baseline.
Frequently Asked Questions
What is a good ROI for marketing automation?
A good ROI for marketing automation is any figure above 100% after a holdout test. At that level the program returns more than double its cost. B2B teams with long sales cycles should judge the result over 24 months. Compare it with other channels using the same gross profit method.
Is marketing automation worth it for small B2B teams?
Marketing automation is worth it for a small B2B team when lead volume and repeat tasks justify the cost. A team with low lead volume may gain more from CRM workflows first. Start with a Starter tier and upgrade once nurture programs prove incremental revenue.
Which metrics show marketing automation is working?
The marketing automation kpis that show progress are closed-won rate, pipeline contribution, sales cycle length and customer acquisition cost. Open and click rates help diagnose content problems, but they do not prove return. Report the revenue metrics monthly and the diagnostic metrics weekly to the campaign team.
How often should you recalculate marketing automation ROI?
Recalculate marketing automation ROI every quarter, and run a full review once a year at renewal. Quarterly checks catch rising licence costs or falling close rates early. The annual review should include a fresh holdout test, because buyer behaviour and the product mix change over time.
Can AI features raise the return of marketing automation?
AI features can raise the return when they cut manual work or improve targeting. Predictive lead scoring and send-time optimisation are examples. They also add licence cost on higher tiers. Test each AI feature against a control group before upgrading, and count the extra fee in the calculation.
How Can Unboxx Help You Prove Marketing Automation ROI?
Unboxx helps B2B teams build the data, CRM integration and attribution setup that make marketing automation ROI measurable. The team works across HubSpot, Salesforce Account Engagement and Dynamics 365. One client project closed email marketing gaps with Account Engagement automation.
If your report still stops at opens and clicks, start with a cost and gain model your finance team trusts. Schedule a consultation with Unboxx to review your current setup and the first marketing automation roi baseline worth tracking.
Let's create something out of this world together.
Have a project in mind? Contact us for expert design and development solutions. Let's discuss how we can help grow your business.
Ready to Unboxx Your Potential?
Build smarter systems. Automate faster. Scale confidently.